Union Pacific 2005 Annual Report Download - page 2
Download and view the complete annual report
Please find page 2 of the 2005 Union Pacific annual report below. You can navigate through the pages in the report by either clicking on the pages listed below, or by using the keyword search tool below to find specific information within the annual report.-
 1
1 -
 2
2 -
 3
3 -
 4
4 -
 5
5 -
 6
6 -
 7
7 -
 8
8 -
 9
9 -
 10
10 -
 11
11 -
 12
12 -
 13
13 -
14
-
15
-
16
-
17
-
18
-
19
-
20
-
21
-
22
-
23
-
24
-
25
-
26
-
27
-
28
-
29
-
30
-
31
-
32
-
33
-
34
-
35
-
36
-
37
-
38
-
39
-
40
-
41
-
42
-
43
-
44
-
45
-
46
-
47
-
48
-
49
-
50
-
51
-
52
-
53
-
54
-
55
-
56
-
57
-
58
-
59
-
60
-
61
-
62
-
63
-
64
-
65
-
66
-
67
-
68
-
69
-
70
-
71
-
72
-
73
-
74
-
75
-
76
-
77
-
78
-
79
-
80
-
81
-
82
-
83
-
84
-
85
-
86
-
87
-
88
-
89
-
90
-
91
-
92
-
93
-
94
-
95
-
96
-
97
-
98
-
99
-
100
 |
 |

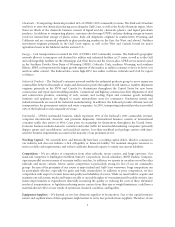
OPERATING REVENUES
In millions of dollars
OPERATING INCOME
In millions of dollars
LEASE ADJUSTED
DEBT TO CAPITAL*
Percentage
2005 STOCK PRICE
COMPARISON
Percentage
2,018
2,253
1,295
1,795
10,830
11,159
11,551
12,215
13,578 55.0
51.7
44.8 45.1 43.6
-1
+3
+20
2,133
Dow S&P
500
UNP
*Refer to footnote (e) above
01 01 01 02 03 04 0502 03 04 0502 03 04 05
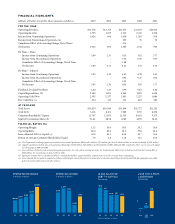
financial HigHligHts
Millions of Dollars, Except Per Share Amounts and Ratios 2005 2004 2003 2002 2001
for tHe Year
Operating Revenues $13,578 $12,215 $11,551 $11,159 $10,830
Operating Income 1,795 1,295 2,133 2,253 2,018
Income from Continuing Operations 1,026 604 1,056 1,265 934
Income from Discontinued Operations (a) - - 255 76 32
Cumulative Effect of Accounting Change, Net of Taxes - - 274 - -
Net Income 1,026 604 1,585 1,341 966
Per Share
—
Basic:
Income from Continuing Operations 3.89 2.33 4.15 5.02 3.77
Income from Discontinued Operations - - 1.00 0.30 0.13
Cumulative Effect of Accounting Change, Net of Taxes - - 1.08 - -
Net Income 3.89 2.33 6.23 5.32 3.90
Per Share
—
Diluted:
Income from Continuing Operations 3.85 2.30 4.07 4.78 3.65
Income from Discontinued Operations - - 0.95 0.27 0.12
Cumulative Effect of Accounting Change, Net of Taxes - - 1.02 - -
Net Income 3.85 2.30 6.04 5.05 3.77
Dividends Declared Per Share 1.20 1.20 0.99 0.83 0.80
Capital Expenditures (b) 2,169 1,876 1,940 1,820 1,696
Operating Cash Flow 2,595 2,257 2,443 2,237 1,886
Free Cash Flow (c) 234 215 712 662 285
at Year-end
Total Assets $35,620 $34,596 $33,496 $32,772 $31,552
Total Debt 7,416 8,131 7,989 7,703 8,078
Common Shareholders’ Equity 13,707 12,655 12,354 10,651 9,575
Equity Per Common Share (d) 51.41 48.58 47.85 41.99 38.26
financial ratios (%)
Operating Margin 13.2 10.6 18.5 20.2 18.6
Operating Ratio 86.8 89.4 81.5 79.8 81.4
Lease Adjusted Debt to Capital (e) 43.6 45.1 44.8 51.7 55.0
Return on Average Common Shareholders’ Equity 7.8 4.8 13.8 13.3 10.6
(a) The Corporation’s trucking segment is presented as discontinued operations. 2003 results include a $211 million gain on sale, which includes an income tax benefit of $126 million.
(b) Capital expenditures include non-cash capital lease financings of $188 million, $126 million, and $124 million in 2003, 2002 and 2001, respectively. There were no non-cash capital
lease financings in 2005 and 2004.
(c) Free cash flow is defined as cash provided by operating activities, less cash used in investing activities, less dividends paid. 2003 results exclude proceeds from the Overnite IPO of
$620 million. See reconciliation in Item 7 of Form 10-K.
(d) Equity per common share is calculated as follows: common shareholders’ equity divided by common shares issued less treasury shares outstanding.
(e) Lease adjusted debt to capital is computed as follows: total debt plus convertible preferred securities plus net present value of leases divided by total debt plus equity plus convertible
preferred securities plus net present value of leases.
Union Pacific