Toshiba 2012 Annual Report Download - page 17
Download and view the complete annual report
Please find page 17 of the 2012 Toshiba annual report below. You can navigate through the pages in the report by either clicking on the pages listed below, or by using the keyword search tool below to find specific information within the annual report.-
 1
1 -
2
-
3
-
4
-
5
-
6
-
 7
7 -
 8
8 -
 9
9 -
 10
10 -
 11
11 -
 12
12 -
 13
13 -
 14
14 -
 15
15 -
 16
16 -
 17
17 -
 18
18 -
 19
19 -
 20
20 -
 21
21 -
 22
22 -
 23
23 -
 24
24 -
 25
25 -
 26
26 -
 27
27 -
28
-
29
-
30
-
31
-
32
-
33
-
34
-
35
-
36
-
37
-
38
-
39
-
40
-
41
-
42
-
43
-
44
-
45
-
46
-
47
-
48
-
49
-
50
-
51
-
52
-
53
-
54
-
55
-
56
-
57
-
58
-
59
-
60
-
61
-
62
-
63
-
64
-
65
-
66
-
67
-
68
-
69
-
70
-
71
-
72
-
73
-
74
-
75
-
76
-
77
-
78
-
79
-
80
-
81
-
82
-
83
-
84
-
85
-
86
-
87
-
88
-
89
-
90
-
91
-
92
-
93
-
94
-
95
-
96
-
97
-
98
-
99
-
100
-
101
-
102
-
103
-
104
-
105
-
106
-
107
-
108
-
109
-
110
-
111
-
112
-
113
-
114
-
115
-
116
-
117
-
118
-
119
-
120
-
121
-
122
-
123
-
124
-
125
-
126
-
127
-
128
-
129
-
130
-
131
-
132
-
133
-
134
-
135
-
136
-
137
-
138
 |
 |

24%
31%
45%
33%+20%
+10%
-1%
+8%
+3%
+2%
32%
35%
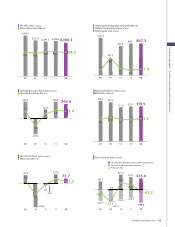
FY11 FY12 FY13 FY14
FY11 FY14
CAGR
Toshiba Market*1
*1: IMF World Economic Outlook Apr. 2012, nominal GDP
FY11-14 net sales CAGR: 9%
GDP CAGR: 5%
*1
(Billions of yen)
Emerging
economies
U.S., Europe
Japan
206.6
Operating
Income 300.0 350.0
450.0
6,100.3
Net Sales 6,400.0 7,100.0
7,800.0
Numerical Targets
Realize double-digit sales growth in emerging economies
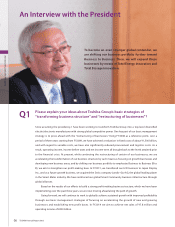
Investment and R&D Expenditures
Establish new pro t basis by promoting focus businesses
FY12-14FY11-13
Accumulated
plan
Focus
business areas
New business
areas
FY12-14 FY11 FY12 FY14FY11-13
D/E
ratio
ROI*4
FCF*3
CIF*2 Expand resources for growth
by securing enough capital
Digital Products
Electronic
Devices
Shareholders’
equity
Interest-
bearing
debt
Social
Infrastructure
Home Appliances
Utilize ¥700 billion of improved assets and shiftable funds to make appropriate new investments
*2: Corporate Initiative Fund *3: Free Cash Flow *4: Operating income/(shareholders’ equity + interest-bearing debt)
8.7%
-42.2
13%
150.0
20%
250.0
Shareholders’
equity ratio
15%16%22%
1,020.0 1,080.0
1,308.0 1,370.0
142%
108%
53%
(Billions of yen)
Shiftable
funds
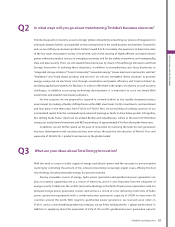
FY11 (results) FY12 (forecast) FY14 (plan) CAGR FY12-FY14
Digital
Products
Net Sales 1,664.0 1,710.0 2,060.0 10%
Operating Income -28.2 15.0 50.0
Electronic
Devices
Net Sales 1,436.9 1,640.0 2,060.0 12%
Operating Income 75.4 100.0 180.0
Social
Infrastructure
Net Sales 2,412.8 2,600.0 3,240.0 12%
Operating Income 134.2 165.0 220.0
Home Appliances
& Others
Net Sales 576.8 640.0 700.0 5%
Operating Income 5.7 10.0 20.0
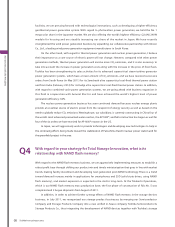
R&D expenditures Capital expenditures,
investment & loans Financial base
Note: Figures exclude sales and operating income of Toshiba Mobile Display Co., Ltd.
(Billions of yen)
Mid-term Business Plan
15
TOSHIBA Annual Report 2012