TomTom 2013 Annual Report Download - page 9
Download and view the complete annual report
Please find page 9 of the 2013 TomTom annual report below. You can navigate through the pages in the report by either clicking on the pages listed below, or by using the keyword search tool below to find specific information within the annual report.-
 1
1 -
 2
2 -
 3
3 -
 4
4 -
 5
5 -
 6
6 -
 7
7 -
 8
8 -
 9
9 -
 10
10 -
 11
11 -
 12
12 -
 13
13 -
 14
14 -
 15
15 -
 16
16 -
 17
17 -
 18
18 -
 19
19 -
 20
20 -
21
-
22
-
23
-
24
-
25
-
26
-
27
-
28
-
29
-
30
-
31
-
32
-
33
-
34
-
35
-
36
-
37
-
38
-
39
-
40
-
41
-
42
-
43
-
44
-
45
-
46
-
47
-
48
-
49
-
50
-
51
-
52
-
53
-
54
-
55
-
56
-
57
-
58
-
59
-
60
-
61
-
62
-
63
-
64
-
65
-
66
-
67
-
68
-
69
-
70
-
71
-
72
-
73
-
74
-
75
-
76
-
77
-
78
-
79
-
80
-
81
-
82
-
83
-
84
-
85
-
86
-
87
-
88
-
89
-
90
-
91
-
92
-
93
 |
 |

Financial and Business Review
2013 was a solid year for us, both financially and
operationally. We were able to launch important new
products, such as our new PND range and our first own
branded GPS sports watches, and to increase the velocity
and productivity of our development activities. Revenue,
although lower compared to last year, overall performed
well relative to market trends, and the gross margin
increased. We invested more in new product development
and in acquisitions than in recent years and generated
significant cash from operations. We achieved a positive net
cash position mid-way through the year and built on this
through to the end of the year.
Overview
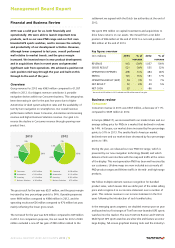
Group revenue for 2013 was €963 million compared to €1,057
million in 2012. Our biggest revenue contributor is portable
navigation devices within our Consumer business. This category has
been decreasing in size for the past few years due to higher
Automotive in-dash system adoption rates and the availability of
turn-by-turn navigation on smartphones. Our overall revenue
performance reflects lower Consumer, Automotive and Licensing
revenue and higher Business Solutions revenue. Our goal is to
reverse the decline in Consumer revenue through growing new
product lines.
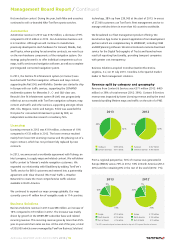
59%
12%
60%
13%
7%9%
20%20%
Consumer € 567 million
Automotive € 192 million
Licensing € 119 million
Business Solutions € 85 million
Consumer € 639 million
Automotive € 212 million
Licensing € 133 million
Business Solutions € 73 million
2013 2012
The gross result for the year was €521 million, and the gross margin
increased by two percentage points to 54%. Operating expenses
were €496 million compared to €484 million in 2012, and the
operating result was €26 million compared to €70 million last year,
mainly reflecting the lower gross result.
The net result for the year was €20 million compared to €49 million
in 2012. For comparison purposes, the net result for 2012 of €49
million excluded a one-off tax gain of €80 million related to the
settlement we agreed with the Dutch tax authorities at the end of
2012.
We spent €92 million on capital investments and acquisitions to
drive future returns on our assets. We moved from a net debt
position of €86 million at the end of 2012 to a net cash position of
€83 million at the end of 2013.
Key figures overview
(€ in millions) 2013 % of
revenue
2012 % of
revenue
REVENUE 963 100% 1,057 100%
GROSS RESULT 521 54% 555 52%
OPERATING EXPENSES 496 51% 484 46%
EBITDA 143 15% 181 17%
OPERATING RESULT (EBIT) 26 3% 70 7%
NET RESULT120 2% 49 5%
NET CASH 83 - –86 -
1Net result of €49 million in 2012 excludes an €80 million one-off tax gain.
Business review
Consumer
Consumer revenue in 2013 was €567 million, a decrease of 11%
compared to €639 million in 2012.
In Europe (EMEA17), we increased both our market share and our
average selling price for PNDs in a market that declined in volume
by 14%. In Europe, our market share increased by five percentage
points to 51% in 2013. The smaller North American market
declined more and our market share decreased by four percentage
points to 18%.
During the year, we released our new PND GO range, which is
powered by our new navigation technology (Navkit) and which
delivers a fresh user interface with the map and traffic at the centre
of the display. This next-generation PND has been well received by
our customers. Lifetime maps are now included across nearly all
PND product ranges and lifetime traffic in the mid- and high-range
products.
We follow multiple element revenue recognition for bundled
product sales, which means that we defer part of the initial selling
price and recognise it in our income statement over a number of
years. This reduces revenue in our income statement in the first
years following the introduction of such bundled sales.
In the emerging sports segment, we doubled revenue year on year
and launched our first ranges of TomTom own-branded GPS sports
watches into the market. The new TomTom Runner and TomTom
Multi-Sport GPS sports watches are ultra-slim and feature an extra-
large display, full-screen graphical training tools and the industry's
Management Board Report
ANNUAL REPORT AND ACCOUNTS 2013 / 9