TomTom 2013 Annual Report Download - page 65
Download and view the complete annual report
Please find page 65 of the 2013 TomTom annual report below. You can navigate through the pages in the report by either clicking on the pages listed below, or by using the keyword search tool below to find specific information within the annual report.-
 1
1 -
2
-
3
-
4
-
5
-
6
-
7
-
8
-
9
-
10
-
11
-
12
-
13
-
14
-
15
-
16
-
17
-
18
-
19
-
20
-
21
-
22
-
23
-
24
-
25
-
26
-
27
-
28
-
29
-
30
-
31
-
32
-
33
-
34
-
35
-
36
-
37
-
38
-
39
-
40
-
41
-
42
-
43
-
44
-
45
-
46
-
47
-
48
-
49
-
50
-
51
-
52
-
53
-
54
-
 55
55 -
 56
56 -
 57
57 -
 58
58 -
 59
59 -
 60
60 -
 61
61 -
 62
62 -
 63
63 -
 64
64 -
 65
65 -
 66
66 -
 67
67 -
 68
68 -
 69
69 -
 70
70 -
 71
71 -
 72
72 -
 73
73 -
 74
74 -
 75
75 -
76
-
77
-
78
-
79
-
80
-
81
-
82
-
83
-
84
-
85
-
86
-
87
-
88
-
89
-
90
-
91
-
92
-
93
 |
 |

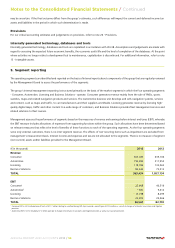
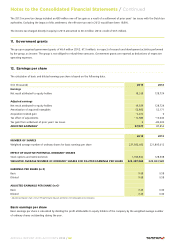
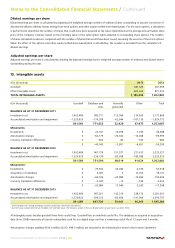
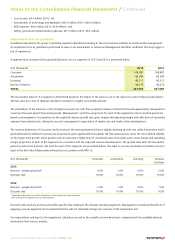
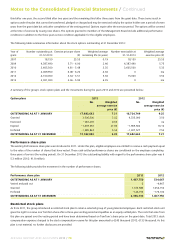
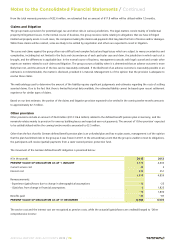
The impairment test performed resulted in no goodwill impairment for 2013 and 2012 for any of the segments.
Management performed a sensitivity analysis on the relevant key assumptions in our 2013 year-end annual impairment testing.
The sensitivity test for the Automotive segment showed that the level of headroom available at year end 2013 (headroom: €52 million) would
fall to nil should the compound revenue growth rate in the forecasted period decrease from 6.5% to 5.8%. A reasonably possible change in
either the perpetual revenue growth rate or discount rate would not reduce the headroom to nil.
The sensitivity test for the Licensing segment showed that the level of headroom available at year end 2013 (headroom: €64 million) would
fall to nil should the compound revenue growth rate in the forecasted period decrease from -2.4% to -4.7%. A reasonably possible change
in either the perpetual revenue growth rate or discount rate would not reduce the headroom to nil.
For Consumer and Business Solutions, a reasonably possible change in any of the above-mentioned key assumptions as well as other
assumptions in the forecasted period would not cause the fair value less costs of disposal of either unit to fall below the level of their respective
carrying value.
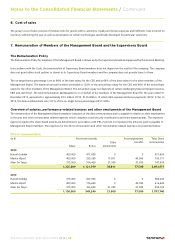
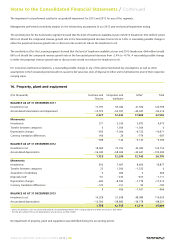
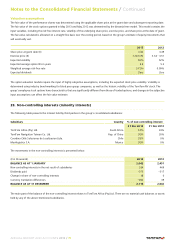
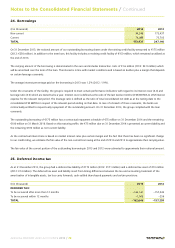
14. Property, plant and equipment
(€ in thousands) Furniture and
fixtures
Computers and
hardware
Other1Total
BALANCE AS AT 31 DECEMBER 2011
Investment cost 17,797 65,040 41,932 124,769
Accumulated amortisation and impairment –15,570 –52,597 –24,047 –92,214
2,227 12,443 17,885 32,555
Movements
Investments 271 5,330 3,872 9,473
Transfer between categories 0 1,504 –1,504 0
Depreciation charges –935 –7,004 –6,732 –14,671
Currency translation differences 166 26 –779 –587
–498 –144 –5,143 –5,785
BALANCE AS AT 31 DECEMBER 2012
Investment cost 18,069 70,703 43,383 132,155
Accumulated depreciation –16,340 –58,404 –30,641 –105,385
1,729 12,299 12,742 26,770
Movements
Investments 810 7,467 8,600 16,877
Transfer between categories 25 1,500 –1,525 0
Acquisition of subsidiary 0 466 0 466
Disposals (net)2–61 –233 –817 –1,111
Depreciation charges –643 –8,593 –7,779 –17,015
Currency translation differences –122 –151 90 –183
9 456 –1,431 –966
BALANCE AS AT 31 DECEMBER 2013
Investment cost 14,328 51,638 48,089 114,055
Accumulated depreciation –12,590 –38,883 –36,778 –88,251
1,738 12,755 11,311 25,804
1Other assets balance as at 31 Dec 2013 mainly comprises of leasehold improvements with a carrying value of €5.0 million (31 Dec 2012: €5.8 million).
2The total gross amount of the assets disposed across all asset classes was €36.3 million.
No impairment of property, plant and equipment was identified during the accounting period.
Notes to the Consolidated Financial Statements / Continued
ANNUAL REPORT AND ACCOUNTS 2013 / 65