Tesco 1999 Annual Report Download - page 5
Download and view the complete annual report
Please find page 5 of the 1999 Tesco annual report below. You can navigate through the pages in the report by either clicking on the pages listed below, or by using the keyword search tool below to find specific information within the annual report.-
 1
1 -
 2
2 -
 3
3 -
 4
4 -
 5
5 -
 6
6 -
 7
7 -
 8
8 -
 9
9 -
 10
10 -
 11
11 -
 12
12 -
 13
13 -
 14
14 -
 15
15 -
 16
16 -
17
-
18
-
19
-
20
-
21
-
22
-
23
-
24
-
25
-
26
-
27
-
28
-
29
-
30
-
31
-
32
-
33
-
34
-
35
-
36
-
37
-
38
-
39
-
40
-
41
-
42
-
43
-
44
 |
 |

TESCO PLC ANNUAL REPORT 1999 3
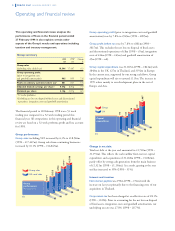
Sales growth for the industry has again been slow, as expected,
reflecting lower inflation and a modest slowdown in volume
growth from the very high levels of recent years. Our market
share, based on estimates of IGD data, increased again to 15.8%
in the year to December 1998, from 15.2% last year. Overall, it
has been a challenging year for the industry, but our business
has remained focused on our customers and has achieved good
results. Over the last six years, sales volumes have grown by 22%.
UK retail sales have grown by 8.0% to £17,070m (1998 –
£15,799m), of which 4.0% came from existing stores including
volume growth of 2.5%. New stores contributed a further
4.3% to total sales growth before closures of 0.3%.
15.8
4.3
8.9
7. 5
6.1
4.0
19.8
12.8
8.0
12.7*
99
98
97
96
95
UK like-for-like
sales growth
Total UK growth
%
Sales growth
*52 weeks proforma
UK performance
1999 1998* Change
£m £m %
Food retail sales
(including value added tax) 17,070 15,799 8.0
Operating profit 919 859 7.0
*52 weeks proforma
8.0
5.5
19.2
15.1
30.7
22.7
Tesco
Market
%
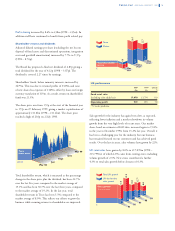
Total shareholder
return
One
year
Three
years
Five
years
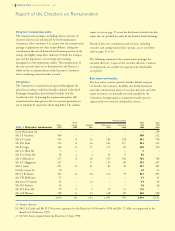
Profit-sharing increased by 8.6% to £38m (1998 – £35m). In
addition staff have continued to benefit from profit related pay.
Shareholder returns and dividends
Adjusted diluted earnings per share (excluding the net loss on
disposal of fixed assets and discontinued operations, integration
costs and goodwill amortisation) increased by 7.7% to 9.37p
(1998 – 8.70p).
The Board has proposed a final net dividend of 2.87p giving a
total dividend for the year of 4.12p (1998 – 3.87p). The
dividend is covered 2.27 times by earnings.
Shareholders’ funds, before minority interests, increased by
£479m. This was due to retained profits of £329m and issue
of new shares less expenses of £169m, offset by losses on foreign
currency translation of £19m. As a result, return on shareholders’
funds was 21.3%.
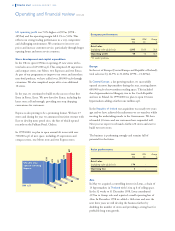
The share price rose from 172p at the start of the financial year
to 177p on 27 February 1999, giving a market capitalisation of
approximately £11.8bn (1998 – £11.4bn). The share price
reached a high of 202p on 2 July 1998.
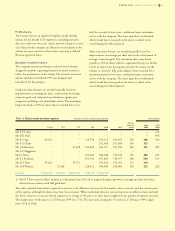
Total shareholder return, which is measured as the percentage
change in the share price plus the dividend, has been 22.7%
over the last five years, compared to the market average of
15.1% and has been 30.7% over the last three years, compared
to the market average of 19.2%. In the last year, total
shareholder return in Tesco has been 5.5% compared to the
market average of 8.0%. This reflects our efforts to grow the
business while ensuring returns to shareholders are improved.
Mar 98
Jun
Sept
Dec
Mar 99
172.0
178.1
180.0
174.0
177.0
Tesco
share price
pence