Tecumseh Products 2012 Annual Report Download - page 16
Download and view the complete annual report
Please find page 16 of the 2012 Tecumseh Products annual report below. You can navigate through the pages in the report by either clicking on the pages listed below, or by using the keyword search tool below to find specific information within the annual report.-
 1
1 -
2
-
3
-
4
-
5
-
 6
6 -
 7
7 -
 8
8 -
 9
9 -
 10
10 -
 11
11 -
 12
12 -
 13
13 -
 14
14 -
 15
15 -
 16
16 -
 17
17 -
 18
18 -
 19
19 -
 20
20 -
 21
21 -
 22
22 -
 23
23 -
 24
24 -
 25
25 -
 26
26 -
27
-
28
-
29
-
30
-
31
-
32
-
33
-
34
-
35
-
36
-
37
-
38
-
39
-
40
-
41
-
42
-
43
-
44
-
45
-
46
-
47
-
48
-
49
-
50
-
51
-
52
-
53
-
54
-
55
-
56
-
57
-
58
-
59
-
60
-
61
-
62
-
63
-
64
-
65
-
66
-
67
-
68
-
69
-
70
-
71
-
72
-
73
-
74
-
75
-
76
-
77
 |
 |

15
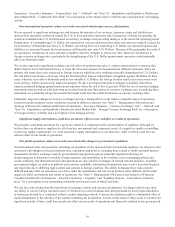
Stock Performance Graph
The following graph and table depict the cumulative total shareholder return (assuming reinvestment of dividends) on $100 invested
in each class of Tecumseh common stock, the S&P 500 Index, and the S&P Composite Industry Index for the five year period
from December 31, 2007 through December 31, 2012.
Base INDEXED RETURNS
Period Years Ending
Company / Index 2007 2008 2009 2010 2011 2012
Tecumseh Products Company - Class A....... 100 40.92 49.94 55.75 20.08 19.74
Tecumseh Products Company - Class B....... 100 48.48 58.88 66.24 22.59 23.35
S&P 500 Index.............................................. 100 63.00 79.67 91.68 93.61 108.59
S&P Composite Industry Index *................. 100 62.63 91.93 119.84 90.98 157.09
* S&P Composite Industry Index comprises the S&P Household Appliances Index (50%), the S&P Industrial Machinery Index
(25%) and the S&P Electrical Components and Equipment Index (25%).