TD Bank 2007 Annual Report Download - page 3
Download and view the complete annual report
Please find page 3 of the 2007 TD Bank annual report below. You can navigate through the pages in the report by either clicking on the pages listed below, or by using the keyword search tool below to find specific information within the annual report.-
 1
1 -
 2
2 -
 3
3 -
 4
4 -
 5
5 -
 6
6 -
 7
7 -
 8
8 -
 9
9 -
 10
10 -
 11
11 -
 12
12 -
 13
13 -
 14
14 -
15
-
16
-
17
-
18
-
19
-
20
-
21
-
22
-
23
-
24
-
25
-
26
-
27
-
28
-
29
-
30
-
31
-
32
-
33
-
34
-
35
-
36
-
37
-
38
-
39
-
40
-
41
-
42
-
43
-
44
-
45
-
46
-
47
-
48
-
49
-
50
-
51
-
52
-
53
-
54
-
55
-
56
-
57
-
58
-
59
-
60
-
61
-
62
-
63
-
64
-
65
-
66
-
67
-
68
-
69
-
70
-
71
-
72
-
73
-
74
-
75
-
76
-
77
-
78
-
79
-
80
-
81
-
82
-
83
-
84
-
85
-
86
-
87
-
88
-
89
-
90
-
91
-
92
-
93
-
94
-
95
-
96
-
97
-
98
-
99
-
100
-
101
-
102
-
103
-
104
-
105
-
106
-
107
-
108
-
109
-
110
-
111
-
112
-
113
-
114
-
115
-
116
-
117
-
118
-
119
-
120
-
121
-
122
-
123
-
124
-
125
-
126
-
127
-
128
-
129
-
130
-
131
-
132
-
133
-
134
-
135
-
136
-
137
-
138
 |
 |

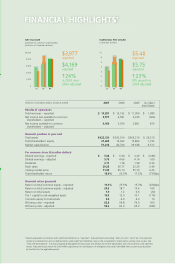
NET INCOME
available to common shareholders
(millions of Canadian dollars)
05 06 07
05
06
07
$5,000
4,000
3,000
2,000
1,000
0
EARNINGS PER SHARE
(Canadian dollars)
05 06 07
05
06
07
5
6
$7
4
3
2
1
0
(millions of Canadian dollars, except as noted) 2007 2006 2005 inc./(dec.
2007/2006
)
Results of operations
Total revenues – reported $ 14,281 $ 13,192 $ 11,959 $ 1,089
Net income loss available to common
shareholders – reported
3,977 4,581 2,229 (604)
Net income available to common
shareholders – adjusted
4,169 3,354 2,861 815
Financial position at year end
Total assets $ 422,124 $ 392,914 $ 365,210 $ 29,210
Total shareholders’ equity 21,404 19,632 15,866 1,722
Market capitalization 51,216 46,704 39,648 4,512
Per common share (Canadian dollars)
Diluted earnings – reported $ 5.48 $ 6.34 $ 3.20 $ (0.86)
Diluted earnings – adjusted 5.75 4.66 4.14 1.09
Dividends 2.11 1.78 1.58 0.33
Book value 29.23 26.77 22.29 2.46
Closing market price 71.35 65.10 55.70 6.25
Total shareholder return 13.0% 20.3% 17.2% (730)bps
Financial ratios (percent)
Return on total common equity – reported 19.3% 25.5% 15.3% (620)bps
Return on total common equity – adjusted 20.3 18.7 19.6 160
Return on total assets 1.0 1.2 0.6 (20)
Tier 1 capital to risk-weighted assets 10.3 12.0 10.1 (170)
Common equity to total assets 5.0 4.9 4.3 10
Efficiency ratio – reported 62.8 59.8 74.0 300
Efficiency ratio – adjusted 59.6 62.4 65.2 (280)
FINANCIAL HIGHLIGHTS1
$3,977
reported
$4,169
adjusted
24%
in 2007 over
2006 adjusted
$5.48
reported
$5.75
adjusted
23%
EPS growth in
2007 adjusted
1 Results prepared in accordance with GAAP are referred to as “reported”. Adjusted results (excluding “items of note”, net of tax, from reported
results) and related terms are not defined terms under GAAP and therefore, may not be comparable to similar terms used by other issuers. See
“How the Bank Reports” in the accompanying Management’s Discussion and Analysis for further explanation and a reconciliation with reported
results. Adjusted results shown for 2005 reflect adjustments for amortization of intangibles and certain identified items as previously disclosed
by the Bank for the applicable period.
•
•
•
•