TD Bank 2007 Annual Report Download - page 13
Download and view the complete annual report
Please find page 13 of the 2007 TD Bank annual report below. You can navigate through the pages in the report by either clicking on the pages listed below, or by using the keyword search tool below to find specific information within the annual report.-
 1
1 -
2
-
 3
3 -
 4
4 -
 5
5 -
 6
6 -
 7
7 -
 8
8 -
 9
9 -
 10
10 -
 11
11 -
 12
12 -
 13
13 -
 14
14 -
 15
15 -
 16
16 -
 17
17 -
 18
18 -
 19
19 -
 20
20 -
 21
21 -
 22
22 -
 23
23 -
24
-
25
-
26
-
27
-
28
-
29
-
30
-
31
-
32
-
33
-
34
-
35
-
36
-
37
-
38
-
39
-
40
-
41
-
42
-
43
-
44
-
45
-
46
-
47
-
48
-
49
-
50
-
51
-
52
-
53
-
54
-
55
-
56
-
57
-
58
-
59
-
60
-
61
-
62
-
63
-
64
-
65
-
66
-
67
-
68
-
69
-
70
-
71
-
72
-
73
-
74
-
75
-
76
-
77
-
78
-
79
-
80
-
81
-
82
-
83
-
84
-
85
-
86
-
87
-
88
-
89
-
90
-
91
-
92
-
93
-
94
-
95
-
96
-
97
-
98
-
99
-
100
-
101
-
102
-
103
-
104
-
105
-
106
-
107
-
108
-
109
-
110
-
111
-
112
-
113
-
114
-
115
-
116
-
117
-
118
-
119
-
120
-
121
-
122
-
123
-
124
-
125
-
126
-
127
-
128
-
129
-
130
-
131
-
132
-
133
-
134
-
135
-
136
-
137
-
138
 |
 |

2007 PERFORMANCE INDICATORS 2007 RESULTS1
Financial
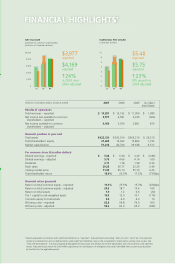
• Deliver above peer average total shareholder return2 • TD return: 13% vs. peer average: 10.7%
• Grow earnings per share by 7% to 10% • 23% EPS growth
• Deliver above peer average return on risk-weighted assets • TD return: 2.80% vs. peer average: 2.09%3
Business Operations
• Grow revenue faster than expenses • Revenue growth exceeded expense growth by over 4%
• Invest in core businesses to improve efficiency • Refer to Business Segment Analysis for details
and effectiveness
C ustomer
• Focus on improving Customer Experience (CEI) Score • Total corporate composite score: 23.54. Represents the
net percentage of customers who are TD brand advocates.
• Invest in core businesses to enhance the customer experience • Refer to Business Segment Analysis for details
• Grow the percentage of employees in customer-facing roles5 • Percentage of customer-facing employees: 68.13%,
up 1.23% vs. 2006
E mployee
• Improve employee engagement score year-over-year • Employee engagement score rose to 4.14 in Fall 2007
vs. 4.12 in Fall 20066
• Enhance the employee experience by:
– Listening to our employees • See TD’s Corporate Responsibility Report available
– Building employment diversity March 2008. Preview on page 132
– Providing a healthy, safe and flexible work environment
– Providing competitive pay, benefits and performance-
based compensation
– Investing in training and development • $68 million invested, up 11% vs. 2006
C ommunity
• Donate a minimum of 1% of domestic pre-tax profits (five • 1.3% or $32.6 million, in donations
year average) to charitable and not-for-profit organizations
• Make positive contributions by:
– Supporting employees’ community involvement and • $220,500 in employee volunteer grants
fundraising efforts
– Promoting children’s health, literacy and education • $10.5 million donated
• P ublished Call to Action Literacy Report
– Protecting and preserving the environment • Launched Environmental Management Framework
• Adopted Equator Principles
• $4 million distributed to over 830 local
environmental projects
More details can be found in TDBFG’s 2007 Corporate Responsibility Report, published in March 2008. See preview on page 132
of this annual report.
1 Performance indicators that include an earnings component are based on
TDBFG’s full year adjusted earnings (except as noted) as explained in “How the
Bank Reports” in the accompanying MD&A. For peers, earnings have been
adjusted on a comparable basis to exclude identified non-underlying items.
2 Total Shareholder Return is measured on a 1 year basis from November 1, 2006
to October 31, 2007.
3 Return on risk-weighted assets measured YTD as at July 31, 2007, for
comparison purposes. TD’s return on risk weighted assets for 2007 was 2.80%.
4 CEI replaces TD’s previous measure of customer satisfaction. CEI is a
measurement program that tracks TD customers’ loyalty and advocacy.
5 Percentage of employees in customer-facing roles is measured as at October
31, 2007. While this will continue to be an important internal measure, the
percentage of employees in customer-facing roles will be excluded from our
2008 performance indicators as there is no direct comparison between TD
and its peers.
6 Scale for employee engagement score is from 1 to 5.
TD BANK FINANCIAL GROUP ANNUAL REPORT 2007 To Our Shareholders 9
TDBFG Performance Indicators
Performance indicators focus effort, communicate our priorities, and benchmark
TDBFG’s performance as we strive to be the better bank. The following table
highlights TD’s performance against these indicators in 2007.