Suzuki 1999 Annual Report Download - page 15
Download and view the complete annual report
Please find page 15 of the 1999 Suzuki annual report below. You can navigate through the pages in the report by either clicking on the pages listed below, or by using the keyword search tool below to find specific information within the annual report.-
 1
1 -
2
-
3
-
4
-
 5
5 -
 6
6 -
 7
7 -
 8
8 -
 9
9 -
 10
10 -
 11
11 -
 12
12 -
 13
13 -
 14
14 -
 15
15 -
 16
16 -
 17
17 -
 18
18 -
 19
19 -
 20
20 -
 21
21 -
 22
22 -
 23
23 -
 24
24 -
 25
25 -
26
-
27
-
28
-
29
-
30
-
31
-
32
-
33
-
34
-
35
 |
 |

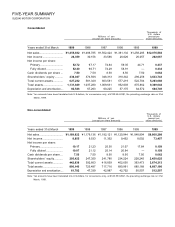
Years ended 31st March 1999 1998 1997 1996 1995 1999
Net sales............................... ¥1,455,832 ¥1,488,785 ¥1,502,424 ¥1,381,132 ¥1,258,285 $12,076,582
Net income........................... 24,359 30,156 33,586 26,626 20,057 202,067
Net income per share:
Primary .............................. 52.72 67.17 74.84 59.35 44.71 0.437
Fully diluted ...................... 52.40 66.71 74.29 58.91 — 0.434
Cash dividends per share ... 7.50 7.50 8.50 8.50 7.50 0.062
Shareholders’ equity........... 438,047 374,566 348,313 318,342 296,256 3,633,743
Total current assets ............. 627,232 581,328 603,581 577,219 522,704 5,203,088
Total assets .......................... 1,131,849 1,037,280 1,009,631 952,603 875,862 9,389,044
Depreciation and amortization....
82,546 67,263 60,225 57,175 64,572 684,749
Note: Yen amounts have been translated into U.S.dollars, for convenience only, at ¥120.55=US$1, the prevailing exchange rate on 31st
March, 1999.
FIVE-YEAR SUMMARY
SUZUKI MOTOR CORPORATION
Consolidated
Non-consolidated
Thousands of
U.S. dollars
Millions of yen (except per
(except per share amounts) share amounts)
Years ended 31st March 1999 1998 1997 1996 1995 1999
Net sales............................... ¥1,189,622 ¥1,179,136 ¥1,182,121 ¥1,120,944 ¥1,048,804 $9,868,288
Net income........................... 8,855 9,533 11,352 9,452 8,002 73,457
Net income per share:
Primary .............................. 19.17 21.23 25.30 21.07 17.84 0.159
Fully diluted ...................... 19.07 21.12 25.14 20.94 — 0.158
Cash dividends per share ... 7.50 7.50 8.50 8.50 7.50 0.062
Shareholders’ equity........... 295,422 247,350 241,780 234,224 228,245 2,450,625
Total current assets ............. 442,938 392,663 416,839 402,630 393,473 3,674,313
Total assets .......................... 806,140 723,487 717,716 690,961 685,168 6,687,186
Depreciation and amortization....
61,782 47,339 42,987 42,702 50,507 512,507
Note: Yen amounts have been translated into U.S.dollars, for convenience only, at ¥120.55=US$1, the prevailing exchange rate on 31st
March, 1999.
Thousands of
U.S. dollars
Millions of yen (except per
(except per share amounts) share amounts)