Stein Mart 2014 Annual Report Download - page 15
Download and view the complete annual report
Please find page 15 of the 2014 Stein Mart annual report below. You can navigate through the pages in the report by either clicking on the pages listed below, or by using the keyword search tool below to find specific information within the annual report.-
 1
1 -
2
-
3
-
4
-
 5
5 -
 6
6 -
 7
7 -
 8
8 -
 9
9 -
 10
10 -
 11
11 -
 12
12 -
 13
13 -
 14
14 -
 15
15 -
 16
16 -
 17
17 -
 18
18 -
 19
19 -
 20
20 -
 21
21 -
 22
22 -
 23
23 -
 24
24 -
 25
25 -
26
-
27
-
28
-
29
-
30
-
31
-
32
-
33
-
34
-
35
-
36
-
37
-
38
-
39
-
40
-
41
-
42
-
43
-
44
-
45
-
46
-
47
-
48
-
49
-
50
-
51
-
52
 |
 |

13
share and three quarterly dividends at $0.075 per share totaling $12.3 million during 2014. We had no direct borrowings on our revolving
credit agreement as of January 31, 2015 and February 1, 2014.
2015 Outlook
For 2015, we expect sales increases to leverage against our efficient expense structure to continue driving earnings, particularly as we add
stores.
We expect the following factors to influence our business in 2015:
xCurrent 2015 plans are to open 11 new stores, relocate one store to better a location in its market, close two stores and
temporarily close one store due to redevelopment of the center, which will reopen in 2016.
xThe gross profit rate is expected to be consistent with the reported 2014 rate of 29.3 percent.
xSelling, general and administrative expenses (SG&A) are expected to increase approximately $15 million from the $338 million
reported in 2014 (not including the $4 million of SEC investigation costs) and include the following items:
oSG&A is expected to be approximately $10 million higher as a result of new and relocated stores, including higher pre-
opening costs and planned payroll increases.
oDepreciation will increase by approximately $2 million.
oCosts and possible penalties related to the SEC investigation that may be incurred in 2015 are not included in our
estimate.
xOn February 3, 2015, we entered into a $250 million second amended and restated credit agreement with Wells Fargo Bank (the
New Credit Agreement) and a $25 million master loan agreement with Wells Fargo Equipment Finance, Inc. (the Equipment
Term Loanand, together with the New Credit Agreement, the Credit Facilities). The Credit Facilities replace the Companys
former $100 million senior secured revolving credit facility. See Note 13 of the Notes to the Consolidated Financial Statements
for further discussion.
xOn February 27, 2015 the Company paid a special cash dividend of $5.00 per common share. The payment made in connection
with this dividend was approximately $226 million, and was funded by existing cash and initial borrowings of $185 million on our
$275 million Credit Facilities. See Note 13 of the Notes to the Consolidated Financial Statements for further discussion.
xDebt is expected to fluctuate mostly between approximately $150 and $200 million in 2015 based on working capital needs and
interest expense is estimated to be approximately $3.5 million in 2015.
xThe effective tax rate for the year is estimated to be approximately 39.0 percent.
xCapital expenditures for 2015 are expected to be approximately $46 million, including $16 million for new and relocated stores,
$13 million for information systems, $13 million for existing stores and $4 million for reconfiguring our corporate office space.
oCapital expenditures, net of tenant improvement allowances, for 2015 are expected to be approximately $34 million.
Change in Accounting Estimate
During the fourth quarter of 2013, we refined our estimation of the buying and distribution costs allocated to inventories. This change
lowered the percentage of expenses allocated to inventory purchases. The decrease in the allocation of costs to inventories resulted in a
$5.0 million pretax non-cash charge ($3.1 million after-tax or $0.07 per diluted share), comprised of a $15.0 million increase in SG&A and a
$10.0 million increase in gross profit.
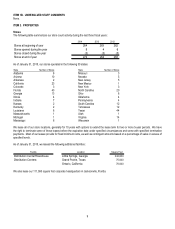
Results of Operations
The following table sets forth each line item of the Consolidated Statements of Income expressed as a percentage of net sales:
2014 2013 2012
Net sales 100.0% 100.0% 100.0%
Cost of merchandise sold 70.7% 70.9% 72.2%
Gross profit 29.3% 29.1% 27.8%
Selling, general and administrative expenses 26.0% 25.9% 24.9%
Operating income 3.3% 3.2% 2.9%
Interest expense, net 0.0% 0.0% 0.0%
Income before income taxes 3.3% 3.2% 2.9%
Income tax expense 1.3% 1.2% 0.9%
Net income 2.0% 2.0% 2.0%