Stein Mart 2014 Annual Report Download - page 13
Download and view the complete annual report
Please find page 13 of the 2014 Stein Mart annual report below. You can navigate through the pages in the report by either clicking on the pages listed below, or by using the keyword search tool below to find specific information within the annual report.-
 1
1 -
2
-
 3
3 -
 4
4 -
 5
5 -
 6
6 -
 7
7 -
 8
8 -
 9
9 -
 10
10 -
 11
11 -
 12
12 -
 13
13 -
 14
14 -
 15
15 -
 16
16 -
 17
17 -
 18
18 -
 19
19 -
 20
20 -
 21
21 -
 22
22 -
 23
23 -
24
-
25
-
26
-
27
-
28
-
29
-
30
-
31
-
32
-
33
-
34
-
35
-
36
-
37
-
38
-
39
-
40
-
41
-
42
-
43
-
44
-
45
-
46
-
47
-
48
-
49
-
50
-
51
-
52
 |
 |

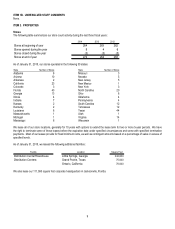
11
Issuer Purchases of Equity Securities
The following table provides information regarding repurchases of our common stock during the quarter ended January 31, 2015:
Total number of Maximum number
Total Average shares purchased of shares that may
number price as part of publicly yet be purchased
of shares paid per announced plans under the plans or
Period purchased share or programs (1) programs (1)
November 2, 2014 - November 29, 2014 477 13.42 477 574,161
November 30, 2014 - January 3, 2015 1,218 14.18 1,218 572,943
January 4, 2015 - January 31, 2015 89,833 13.76 89,833 483,110
Total 91,528 $13.76 91,528 483,110
ISSUER PURCHASES OF EQUITY SECURITIES
(1) Our Open Market Repurchase Program is conducted pursuant to authorizations made from time to time by our Board of Directors. For the quarter ended January 31,
2015, all shares purchased related to withholding taxes due on the vesting of employee stock awards.
Performance Graph
The following graph compares the cumulative five-year shareholder return on our common stock with the cumulative total return to the
NASDAQ Composite Index and the S&P 500 Apparel Retail Index. The comparison assumes $100 was invested at the beginning of the
five year period in Stein Mart, Inc. stock and in each of the indices shown and assumes reinvestment of any dividends.
1/30/2010 1/29/2011 1/28/2012 2/2/2013 2/1/2014 1/31/2015
Stein Mart, Inc. $100.00 $106.2 $98.9 $132.5 $187.7 $212.8
NASDAQ Composite 100.00 126.3 133.7 152.9 200.0 228.7
S&P 500 Apparel Retail 100.00 131.0 172.6 232.8 269.6 340.1
*****
The stock performance graph should not be deemed filed or incorporated by reference into any other filings made by us under the
Securities Act of 1933 or the Securities Exchange Act of 1934, except to the extent that we specifically incorporate the stock performance
graph by reference in another filing.