Stein Mart 2009 Annual Report Download - page 18
Download and view the complete annual report
Please find page 18 of the 2009 Stein Mart annual report below. You can navigate through the pages in the report by either clicking on the pages listed below, or by using the keyword search tool below to find specific information within the annual report.-
 1
1 -
2
-
3
-
4
-
5
-
6
-
7
-
 8
8 -
 9
9 -
 10
10 -
 11
11 -
 12
12 -
 13
13 -
 14
14 -
 15
15 -
 16
16 -
 17
17 -
 18
18 -
 19
19 -
 20
20 -
 21
21 -
 22
22 -
 23
23 -
 24
24 -
 25
25 -
 26
26 -
 27
27 -
 28
28 -
29
-
30
-
31
-
32
-
33
-
34
-
35
-
36
-
37
-
38
-
39
-
40
-
41
-
42
-
43
-
44
-
45
-
46
-
47
-
48
 |
 |

through a combination of internally generated funds, a revolving credit facility and credit terms from vendors. Working capital is
needed to support store inventories and capital investments for new store openings and to maintain existing stores. Historically, our
working capital needs are lowest in the first quarter and highest in either the third or fourth quarter in anticipation of the fourth quarter
peak selling season. As of January 30, 2010, we had $81.0 million in cash and cash equivalents and no direct borrowings on our
revolving credit facility.
Net cash provided by operating activities was $98.3 million in 2009, $19.4 million in 2008 and $17.8 million in 2007. Cash provided by
operating activities increased $79.0 million over 2008. The increase was primarily due to $66.4 million more cash provided by net
income plus non-cash charges and a $37.7 million increase in cash provided by income taxes receivable/payable (including $24.6
million of net operating loss carry back refunds primarily related to our 2008 federal tax return received during 2009), offset by $20.3
million more cash used for inventories and accounts payable and $4.9 million more cash used by other operating activities. While the
end of year 2009 inventory balance is only slightly higher compared to 2008, accounts payable is much higher at the end of 2009
primarily due to approximately $30 million of merchandise in distribution centers at the end of 2009 that was received earlier than at
the end of 2008 as part of our new supply chain network.
Operating cash flows for 2008 increased $1.5 million from 2007 primarily due to $26.9 million less cash used for inventories, a $16.9
million decrease in cash used for income taxes receivable/payable and $8.4 million more cash provided by other operating activities,
offset by $35.4 million less cash provided by net loss plus non-cash charges and $15.3 million more cash used to reduce accounts
payable. Less cash was needed for income taxes in 2008 due to a significant income tax receivable recorded at February 2, 2008.
Inventories decreased in 2008 compared to 2007 due to lower sales resulting in less inventory being purchased and lower inventory
levels.
Net cash used in investing activities was $(7.6) million in 2009, $(19.3) million in 2008 and $(15.1) million in 2007. Capital
expenditures for each year reflect a decrease in the number of store openings each year. The net liquidation of short-term
investments provided $10.8 million of cash in 2007.
Net cash (used in) provided by financing activities was $(98.7) million in 2009, $73.7 million in 2008 and $(5.2) million in 2007. More
cash was used in financing activities during 2009 due to the repayment of all direct borrowings under our revolving credit agreement.
More cash was provided by financing activities during 2008 primarily due to higher net borrowings, no cash dividends paid and fewer
shares of common stock repurchased compared to 2007. In February 2008, the Board of Directors suspended the payment of a
quarterly dividend.
We expect to invest approximately $30 million in capital expenditures in 2010. The cost of opening a new store ranges from $650,000
to $750,000 for fixtures, equipment, leasehold improvements and pre-opening costs (primarily advertising, stocking and training).
Pre-opening costs are expensed at the time of opening. Initial inventory investment for a new store is approximately $800,000.
We have a $150 million senior revolving secured credit agreement (the “Agreement”) with a group of lenders. In January 2010, we
extended the Agreement for one additional year through January 2012. As of January 30, 2010, availability under the Agreement was
$127.1 million and is based on eligible inventory less other reserves as defined in the Agreement. Outstanding letters of credit of
$13.7 million reduced availability for borrowings to $113.4 million at January 30, 2010. We had no direct borrowings at January 30,
2010 and we are in compliance with the terms of the Agreement.
We believe that we will continue to generate positive cash flow from operations, which, along with our available cash and borrowing
capacity under the revolving credit agreement, will provide the means needed to fund our operations for the foreseeable future. While
we have available borrowing capacity under our revolving credit agreement, tightening of the credit markets could make it more
difficult for us to enter into agreements for new indebtedness or obtain funding through public or private equity or debt financing.
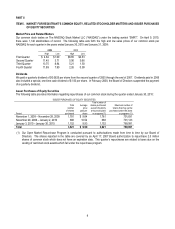
Contractual Obligations
The following table sets forth our contractual obligations at January 30, 2010 (in thousands):
Total
Less than
1 Year
1 – 2
Years
3 – 5
Years
After 5
Years
Operating leases $356,456 $ 76,598 $67,092 $136,075 $76,691
Purchase obligations (a) 209,247 209,247 - - -
Total $565,703 $285,845 $67,092 $136,075 $76,691
(a) Represent open purchase orders with vendors for merchandise not yet received and recorded on our Consolidated Balance Sheet.
The above table does not include long-term debt as we did not have any direct borrowings under our senior revolving credit facility at
January 30, 2010. Other long-term liabilities on the balance sheet include the liability for unrecognized tax benefits, deferred
16