Stein Mart 2009 Annual Report Download - page 14
Download and view the complete annual report
Please find page 14 of the 2009 Stein Mart annual report below. You can navigate through the pages in the report by either clicking on the pages listed below, or by using the keyword search tool below to find specific information within the annual report.-
 1
1 -
2
-
3
-
 4
4 -
 5
5 -
 6
6 -
 7
7 -
 8
8 -
 9
9 -
 10
10 -
 11
11 -
 12
12 -
 13
13 -
 14
14 -
 15
15 -
 16
16 -
 17
17 -
 18
18 -
 19
19 -
 20
20 -
 21
21 -
 22
22 -
 23
23 -
 24
24 -
25
-
26
-
27
-
28
-
29
-
30
-
31
-
32
-
33
-
34
-
35
-
36
-
37
-
38
-
39
-
40
-
41
-
42
-
43
-
44
-
45
-
46
-
47
-
48
 |
 |

charges and the initial valuation allowance for deferred tax assets, may provide a more meaningful measure on which to compare the results of operations
between periods. We believe these non-GAAP results provide useful information to both management and investors by excluding certain charges that impact the
comparability of the results.
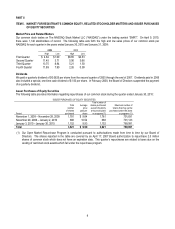
Reconciliations of net income (loss) per diluted share on a GAAP basis to adjusted net income (loss) per diluted share (non-GAAP basis) are presented in the
table below:
2009 2008 2007 2006 2005
Net income (loss) per diluted share (GAAP Basis) $0.54 $(1.72) $(0.11) $0.84 $1.14
Adjustments:
Asset impairment and store closing charges, net of tax 0.17 0.39 0.07 0.04 0.05
Initial valuation allowance for deferred tax assets - 0.46 - - -
Adjustments total 0.17 0.85 0.07 0.04 0.05
Adjusted net income (loss) per diluted share (Non-GAAP Basis) $0.71 $(0.87) $(0.04) $0.88 $1.19
ITEM 7. MANAGEMENT'S DISCUSSION AND ANALYSIS OF FINANCIAL CONDITION AND RESULTS OF OPERATIONS
Overview
Stein Mart is a national retailer offering the fashion merchandise, service and presentation of a better department or specialty store at
prices competitive with off-price retail chains. Our focused assortment of merchandise features current-season moderate to better
fashion apparel for women and men, as well as accessories, gifts, linens and shoes. We believe we differentiate ourselves from
typical off-price retail chains by offering: (i) primarily current-season merchandise carried by better department or specialty stores, (ii)
moderate to better price levels, (iii) a stronger merchandising “statement,” consistently offering more depth of color and size in
individual stock-keeping units, and (iv) merchandise presentation and customer service more comparable to department stores and
upscale retailers.
2009 Highlights
We are proud to have reversed two years of losses and earned a significant profit in one of the most demanding years in our history.
Rigorous focus on inventory levels and freshness, dedication to expense reduction and emphasis on cash generation all contributed
to our profitability this year. We returned to a profit in all four quarters, improved 2009 gross margin by nearly 500 basis points over
2008, reduced selling, general and administrative ("SG&A") expenses by $66.4 million (excluding store closing and impairment
charges), and increased cash generated from operations five-fold. The transformation of our supply chain methodology from direct-
to-store shipments to centralized distribution increased our 2009 gross profit by $1.6 million and decreased SG&A (primarily store
payroll) by $8.4 million for a total improvement on our 2009 pre-tax results of $10.0 million.
For the year ended January 30, 2010, we earned $23.6 million or $0.54 per diluted share compared to a net loss of $(71.3) million or
$(1.72) per diluted share in 2008. The 2009 results include $11.1 million (pre-tax) of store closing and asset impairment charges, or
$0.17 per diluted share. Full year 2008 results include charges totaling $0.85 per share, consisting of $25.4 million (pre-tax) for store
closing and asset impairment charges and a fourth quarter valuation allowance for deferred tax assets of $19.0 million. Excluding
these charges, earnings per diluted share is $0.71 in 2009 compared to a net loss per diluted share of $(0.87) in 2008.
On the balance sheet, we ended 2009 with $81.0 million in cash and no borrowings compared to net debt (borrowings in excess of
cash) of $11.1 million at the end of 2008. During the fourth quarter of 2009, we exercised the option to extend our credit facility for
one year through January 2012. Inventories at the end of 2009 were $218.1 million compared with $207.1 million at the end of 2008.
Inventories at the end of 2009 included approximately $30 million of merchandise in third-party distribution centers that was received
earlier than at the end of 2008 as part of the new supply chain network. These planned earlier receipts also increased accounts
payable at the end of 2009. Excluding the merchandise in our distribution centers, our average store inventory decreased 6.0 percent
at the end of 2009 to $705,000 from $750,000 at the end of 2008.
2010 Outlook
We are planning 2010 conservatively. Our first priority is improving sales, while continuing to focus on expense and operational
controls. With the full deployment of our new supply chain process and a significant information systems enhancement, we believe
we are correctly positioned to further improve our business and attract customers.
We expect the following factors to influence our business in 2010:
x We will continue to manage our inventories in line with our sales and expect them to increase only due to the impact of
merchandise located in the distribution centers due to supply chain.
12