Southwest Airlines 2008 Annual Report Download - page 15
Download and view the complete annual report
Please find page 15 of the 2008 Southwest Airlines annual report below. You can navigate through the pages in the report by either clicking on the pages listed below, or by using the keyword search tool below to find specific information within the annual report.-
 1
1 -
2
-
3
-
4
-
 5
5 -
 6
6 -
 7
7 -
 8
8 -
 9
9 -
 10
10 -
 11
11 -
 12
12 -
 13
13 -
 14
14 -
 15
15 -
 16
16 -
 17
17 -
 18
18 -
 19
19 -
 20
20 -
 21
21 -
 22
22 -
 23
23 -
 24
24 -
 25
25 -
26
-
27
-
28
-
29
-
30
-
31
-
32
-
33
-
34
-
35
-
36
-
37
-
38
-
39
-
40
-
41
-
42
-
43
-
44
-
45
-
46
-
47
-
48
-
49
-
50
-
51
-
52
-
53
-
54
-
55
-
56
-
57
-
58
-
59
-
60
-
61
-
62
-
63
-
64
-
65
-
66
-
67
-
68
-
69
-
70
-
71
-
72
-
73
-
74
-
75
-
76
-
77
-
78
-
79
-
80
-
81
-
82
-
83
-
84
-
85
-
86
-
87
-
88
-
89
-
90
-
91
-
92
-
93
-
94
-
95
-
96
-
97
-
98
-
99
-
100
-
101
-
102
-
103
 |
 |

2008(4)
$ 10,549
145
329
11,023
10,574
449
171
278
100
$ 178
$ .24
$ .24
$ .0180
$ 14,308
$ 3,498
$ 4,953
1.1 %
3.0 %
4.1 %
1.6 %
88,529,234
101,920,598
73,491,687
103,271,343
71.2 %
830
636
1,191,151
$119.16
14.35 ¢
10.67 ¢
10.24 ¢
6.64 ¢
$2.44
1,511
35,499
537
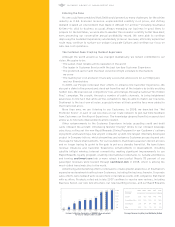
TEN-YEAR SUMMARY Selected Consolidated Financial Data (GAAP)
(Dollars in millions, except per share amounts)
Operating revenues:
Passenger
Freight
Other
Total operating revenues
Operating expenses
Operating income
Other expenses (income), net
Income before income taxes
Provision for income taxes
Net income
Net income per share, basic
Net income per share, diluted
Cash dividends per common share
Total assets
Long-term debt less current maturities
Stockholders’ equity
CONSOLIDATED FINANCIAL RATIOS
Return on average total assets
Return on average stockholders’ equity
Operating margin
Net margin
CONSOLIDATED OPERATING STATISTICS
Revenue passengers carried
Enplaned passengers
RPMs (000s)
ASMs (000s)
Passenger load factor
Average length of passenger haul (miles)
Average stage length (miles)
Trips flown
Average passenger fare
Passenger revenue yield per RPM
Operating revenue yield per ASM
Operating expenses per ASM
Operating expenses per ASM, excluding fuel(2)
Fuel cost per gallon (average)(2)
Fuel consumed, in gallons (millions)
Fulltime equivalent Employees at yearend
Size of fleet at yearend(1)
(1) Includes leased aircraft
(2) Figures for 1999 through 2007 have been restated to include
the reclassication of fuel sales and excise taxes from Other
operating expense to Fuel and oil expense, in order to conform to
the 2008 presentation.
(3) Certain gures include special items related to the September 11,
2001, terrorist attacks and Stabilization Act grant
(4) Includes special items. See Note.
(5) After cumulative effect of change in accounting principle
NOTE: The table included on the inside cover of this report reconciles net income as reported by the Company to
non-GAAP net income by excluding certain special items. The special items, which are net of profitsharing and
income taxes as appropriate, consist primarily of: certain changes in state tax laws (2006, 2007, 2008); certain
gains or losses for derivative instruments associated with the Company’s fuel hedging program, recorded as a
result of SFAS 133, “Accounting for Derivative Instruments and Hedging Activities,” as amended (2004, 2005,
2006, 2007, 2008); out of period retroactive pay associated with the execution of certain labor agreements
(2004); and charges associated with voluntary early-out programs offered to Employees (2004, 2007). In
management’s view, comparative analysis of results can be enhanced by excluding the impact of these items as
the amounts are not indicative of the Company’s operating performance for the applicable period, nor should
they be considered in developing trend analysis for future periods.
2005(4)
$ 7,279
133
172
7,584
6,859
725
(54)
779
295
$ 484
$ .61
$ .60
$ .0180
$ 14,003
$ 1,394
$ 6,675
3.9 %
7.9 %
9.6 %
6.4 %
77,693,875
88,379,900
60,223,100
85,172,795
70.7 %
775
607
1,028,639
$93.68
12.09 ¢
8.90 ¢
8.05 ¢
6.34 ¢
$1.13
1,287
31,729
445
2006(4)
$ 8,750
134
202
9,086
8,152
934
144
790
291
$ 499
$ .63
$ .61
$ .0180
$ 13,460
$ 1,567
$ 6,449
3.6 %
7.6 %
10.3 %
5.5 %
83,814,823
96,276,907
67,691,289
92,663,023
73.1 %
808
622
1,092,331
$104.40
12.93 ¢
9.81 ¢
8.80 ¢
6.34 ¢
$1.64
1,389
32,664
481
2007(4)
$ 9,457
130
274
9,861
9,070
791
(267)
1,058
413
$ 645
$ .85
$ .84
$ .0180
$ 16,772
$ 2,050
$ 6,941
4.3 %
9.6 %
8.0 %
6.5 %
88,713,472
101,910,809
72,318,812
99,635,967
72.6 %
815
629
1,160,699
$106.60
13.08 ¢
9.90 ¢
9.10 ¢
6.40 ¢
$1.80
1,489
34,378
520
14 SOUTHWEST AIRLINES CO. ANNUAL REPORT 2008