Royal Caribbean Cruise Lines 2006 Annual Report Download - page 32
Download and view the complete annual report
Please find page 32 of the 2006 Royal Caribbean Cruise Lines annual report below. You can navigate through the pages in the report by either clicking on the pages listed below, or by using the keyword search tool below to find specific information within the annual report.-
 1
1 -
2
-
3
-
4
-
5
-
6
-
7
-
8
-
9
-
10
-
11
-
12
-
13
-
14
-
15
-
16
-
17
-
18
-
19
-
20
-
21
-
 22
22 -
 23
23 -
 24
24 -
 25
25 -
 26
26 -
 27
27 -
 28
28 -
 29
29 -
 30
30 -
 31
31 -
 32
32 -
 33
33 -
 34
34 -
 35
35 -
 36
36 -
 37
37 -
 38
38 -
 39
39 -
 40
40 -
 41
41 -
 42
42 -
43
-
44
 |
 |

Diluted earnings per share did not include options to purchase 3.2
million shares for the year ended December 31, 2006 and 1.3 mil-
lion for each of the years ended December 31, 2005 and December
31, 2004 because the effect of including them would have been
antidilutive. Also, diluted earnings per share in 2005 did not include
0.2 million shares we received in 2006 in connection with the settle-
ment of an Accelerated Share Repurchase (“ASR”) transaction
because the effect of including them would have been antidilutive.
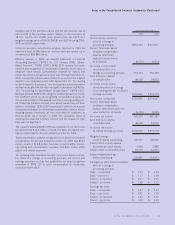
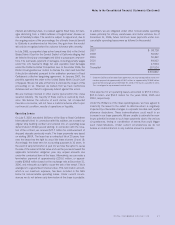
The fair value of each stock option grant is estimated on the date of
grant using the Black-Scholes option pricing model. The estimated fair
value of stock options, less estimated forfeitures, is amortized over the
vesting period using the graded-vesting method. The assumptions
used in the Black-Scholes option-pricing model are as follows:
2006 2005 2004
Dividend yield 1.4% 1.0% 1.1%
Expected stock price volatility 33.0% 48.8% 41.6%
Risk-free interest rate 4.5% 3.5% 3.0%
Expected option life 5 years 5 years 5 years
Upon the adoption of SFAS 123R, expected volatility was based on
a combination of historical and implied volatilities. The risk-free
interest rate is based on U.S. Treasury zero coupon issues with a
remaining term equal to the expected option life assumed at the
date of grant. The expected term was calculated based on historical
experience and represents the time period options actually remain
outstanding. We estimated forfeitures based on historical pre-vesting
forfeitures and shall revise those estimates in subsequent periods
if actual forfeitures differ from those estimates. For purposes of
calculating pro forma information for periods prior to fiscal 2006,
we accounted for forfeitures as they occurred.
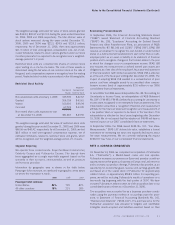
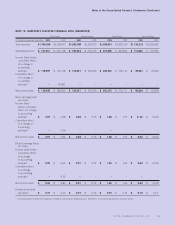
Stock options activity and information about stock options outstand-
ing are summarized in the following tables:
30 ROYAL CARIBBEAN CRUISES LTD.
Stock Options Activity Weighted-
Average
Weighted- Remaining
Average Contractual Aggregate
Number of Exercise Term Intrinsic Value1
Options Price (years) (in thousands)
Outstanding at January 1, 2006 6,858,134 $ 30.00 5.54 $ 103,283
Granted 950,243 44.03
Exercised (1,082,792) 21.26
Canceled (418,032) 42.35
Outstanding at December 31, 2006 6,307,553 32.85 5.41 $ 65,035
Options Exercisable at December 31, 2006 4,415,480 29.11 $ 60,370
1 The intrinsic value represents the amount by which the fair value of stock exceeds the option exercise price.
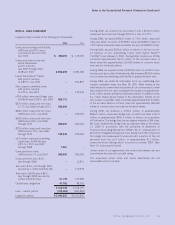
Stock Options Outstanding As of December 31, 2006
Outstanding Exercisable
Weighted- Weighted- Weighted-
Average Average Average
Number of Remaining Exercise Number of Exercise
Exercise Price Range Options Life Price Options Price
$ 9.55 - $20.30 1,423,505 4.75 years $ 12.05 1,363,355 $ 11.76
$21.71 - $28.88 1,200,575 3.92 years $ 25.92 1,107,125 $ 26.23
$28.88 - $40.06 1,187,129 5.98 years $ 37.41 719,186 $ 36.91
$40.06 - $52.95 2,496,344 6.23 years $ 45.87 1,225,814 $ 46.43
6,307,553 5.41 years $ 32.85 4,415,480 $ 29.11
Notes to the Consolidated Financial Statements (Continued)