Royal Caribbean Cruise Lines 2006 Annual Report Download - page 18
Download and view the complete annual report
Please find page 18 of the 2006 Royal Caribbean Cruise Lines annual report below. You can navigate through the pages in the report by either clicking on the pages listed below, or by using the keyword search tool below to find specific information within the annual report.-
 1
1 -
2
-
3
-
4
-
5
-
6
-
7
-
 8
8 -
 9
9 -
 10
10 -
 11
11 -
 12
12 -
 13
13 -
 14
14 -
 15
15 -
 16
16 -
 17
17 -
 18
18 -
 19
19 -
 20
20 -
 21
21 -
 22
22 -
 23
23 -
 24
24 -
 25
25 -
 26
26 -
 27
27 -
 28
28 -
29
-
30
-
31
-
32
-
33
-
34
-
35
-
36
-
37
-
38
-
39
-
40
-
41
-
42
-
43
-
44
 |
 |

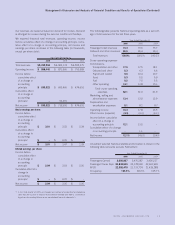
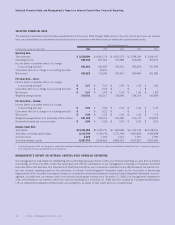
YEAR ENDED DECEMBER 31, 2005 COMPARED TO YEAR
ENDED DECEMBER 31, 2004
Revenues
Net Revenues increased 8.8% in 2005 compared to 2004 due to a
7.4% increase in Net Yields and, to a lesser extent, a 1.4% increase
in capacity. The increase in Net Yields was primarily due to higher
cruise ticket prices and onboard spending. Higher cruise ticket
prices were primarily attributable to a strong demand environment
and a decrease in capacity growth within the industry. The increase
in capacity was primarily attributed to the addition of
Jewel of the
Seas
in 2004, partially offset by
Enchantment of the Seas
, which
was out of service for 53 days due to its lengthening. In addition,
capacity in 2004 was negatively impacted by the cancellation of cer-
tain sailings primarily due to hurricanes and unscheduled drydocks.
Occupancy in 2005 was 106.6% compared to 105.7% in 2004.
Gross Yields increased 6.2% in 2005 compared to 2004 primarily
due to the same reasons discussed above for Net Yields.
Onboard and other revenues included concession revenues of $223.0
million and $196.3 million in 2005 and 2004, respectively. The increase
in concession revenues was primarily due to higher amounts spent
per passenger onboard and the increase in capacity mentioned above.
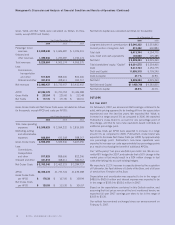
Expenses
Net Cruise Costs increased 7.8% in 2005 compared to 2004 due to
a 6.3% increase in Net Cruise Costs per APCD and the 1.4%
increase in capacity mentioned above. Approximately 4.9 percent-
age points of the increase in Net Cruise Costs per APCD was attrib-
uted to increases in fuel expenses. Total fuel expenses (net of the
financial impact of fuel swap agreements) increased 46.0% per
metric ton in 2005 as compared to an increase of 27.5% in 2004.
As a percentage of total revenues, fuel expenses were 7.5% and
5.5% in 2005 and 2004, respectively. The remaining 1.4 percent-
age points of the increase in Net Cruise Costs per APCD were pri-
marily attributed to increases in personnel costs associated with
benefits. In addition, Net Cruise Costs in 2004 included approxi-
mately $11.3 million in costs related to the impact of hurricanes.
Gross Cruise Costs increased 6.5% in 2005 compared to 2004,
which was a lower percentage increase than Net Cruise Costs pri-
marily due to a lower proportion of passengers who purchased air
transportation from us in 2005.
Depreciation and amortization expenses increased 2.0% in 2005
compared to 2004. The increase was primarily due to the addition
of
Jewel of the Seas
in 2004 as well as depreciation associated with
other capital expenditures, including the lengthening of
Enchantment of the Seas
in 2005.
Other Income (Expense)
Gross interest expense decreased to $287.4 million in 2005 from
$317.2 million in 2004. The decrease was primarily attributable to
lower average debt level, partially offset by higher interest rates.
Interest capitalized increased to $17.7 million in 2005 from $7.2
million in 2004 due to a higher average level of investment in ships
under construction.
In July 2005, First Choice redeemed in full its 6.75% convertible
preferred shares. We received $348.1 million in cash, resulting in a
net gain of $44.2 million, primarily due to foreign exchange.
Cumulative Effect of a Change in Accounting Principle
In the third quarter of 2005, we changed our method of accounting
for drydocking costs from the accrual in advance to the deferral
method (see Note 2.
Summary of Significant Accounting Policies
to
our consolidated financial statements.) The change resulted in a
one-time gain of $52.5 million, or $0.22 per share on a diluted
basis, to recognize the cumulative effect of the change on prior
years, which we reflected as part of our results in 2005. Other than
this one-time gain, the change did not have a material impact on our
consolidated statement of operations.
LIQUIDITY AND CAPITAL RESOURCES
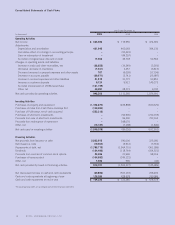
Sources and Uses of Cash
Cash flow generated from operations provides us with a significant
source of liquidity. Net cash provided by operating activities was
$948.5 million in 2006 and $1.1 billion in each of 2005 and 2004.
This decrease was primarily a result of the payment of approximate-
ly $121.2 million of accreted interest in connection with the repur-
chase of our LYONs, a decrease in accounts payable of
approximately $25.9 million and an increase in trade and other
receivables of approximately $19.5 million as compared to 2005.
Net cash used in investing activities increased to $1.8 billion in
2006, from $89.0 million in 2005 and $632.5 million in 2004. The
increase was primarily due to an increase in capital expenditures
which were approximately $1.2 billion for the year ended December
31, 2006 compared to approximately $429.9 million in 2005 and
$630.1 million in 2004. Capital expenditures were primarily related
to ships under construction including the delivery of
Freedom of the
Seas
in 2006, the lengthening of
Enchantment of the Seas
in 2005,
and the delivery of
Jewel of the Seas
in 2004 as well as progress
payments for ships under construction in all years. The increase in
net cash used in investing activities was also driven by the purchase
of Pullmantur which resulted in a cash outlay of approximately
$558.9 million.
Net cash provided by financing activities was $879.7 million in 2006
compared to net cash used in financing activities of $1.5 billion in
2005 and $146.0 million in 2004. The increase in 2006 was prima-
rily due to net proceeds from debt issuances of approximately $2.9
billion including net proceeds of approximately $890.5 million from
a public offering consisting of $550.0 million of 7.0% senior unse-
cured notes due 2013, and $350.0 million of 7.25% senior unse-
cured notes due 2016. In addition, in connection with the financing
of
Freedom of the Seas
, we entered into and drew in full a $570.0
million unsecured term loan with an interest rate of 3.77% due
through 2013. We also obtained a ¤750.0 million, or approximately
$960.5 million, unsecured short-term bridge loan to finance the
acquisition of Pullmantur on which we drew ¤701.0 million, or
approximately $925.1 million. Net cash provided by financing activ-
ities was partially offset by payments on various term loans, senior
16 ROYAL CARIBBEAN CRUISES LTD.
Management’s Discussion and Analysis of Financial Condition and Results of Operations (Continued)