Royal Caribbean Cruise Lines 2003 Annual Report Download - page 16
Download and view the complete annual report
Please find page 16 of the 2003 Royal Caribbean Cruise Lines annual report below. You can navigate through the pages in the report by either clicking on the pages listed below, or by using the keyword search tool below to find specific information within the annual report.-
 1
1 -
2
-
3
-
4
-
5
-
 6
6 -
 7
7 -
 8
8 -
 9
9 -
 10
10 -
 11
11 -
 12
12 -
 13
13 -
 14
14 -
 15
15 -
 16
16 -
 17
17 -
 18
18 -
 19
19 -
 20
20 -
 21
21 -
 22
22 -
 23
23 -
 24
24 -
 25
25 -
 26
26 -
27
-
28
-
29
-
30
-
31
-
32
-
33
-
34
-
35
-
36
 |
 |

14
Year Ended December 31, 2002 Compared to
Year Ended December 31, 2001
REVENUES
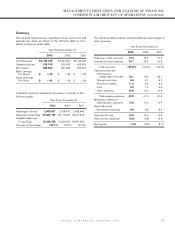
Passenger ticket revenues increased 6.7% to $2.6 billion com-
pared to $2.4 billion in 2001. The increase in passenger ticket
revenues was primarily due to a 15.0% increase in capacity,
partially offset by a lower percentage of passengers who chose
to book their air passage through us and lower cruise ticket
prices. The increase in capacity was associated with the full
year effect of the additions of
Infinity
,
Radiance of the Seas
,
Summit
and
Adventure of the Seas
and the deliveries of
Constellation
,
Brilliance of the Seas
and
Navigator of the Seas
in 2002. The increase in capacity was partially offset by the
transfer of
Viking Serenade
to Island Cruises, our joint venture
with First Choice Holidays PLC in 2002. Lower cruise ticket
prices were attributed to the events of September 11, 2001, a
general softness in the United States economy and an
increase in industry capacity. Occupancy for 2002 was 104.5%
compared to 101.8% in 2001.
Onboard and other revenues increased 17.7% to $0.8 billion in
2002 compared to $0.7 billion in 2001. The increase was mainly
attributable to a 20.7% increase in shipboard revenues resulting
primarily from an increase in capacity. Included in onboard and
other revenues were concession revenues of $162.0 million and
$131.6 million in 2002 and 2001, respectively.
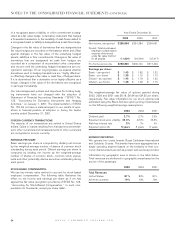
Gross Yields and Net Yields for 2002 decreased 5.1% and
0.7%, respectively, compared to 2001, primarily due to lower
cruise ticket prices. In addition, the decline in Gross Yields was
also due to a lower percentage of passengers who chose to
book their air passage through us.
EXPENSES
Operating expenses increased 9.2% to $2.1 billion in 2002
compared to $1.9 billion in 2001. Included in other operating
expenses in 2002 was a charge of $20.0 million recorded in
connection with a litigation settlement. (See Note 12.
Commitments and Contingencies.) Operating expenses per
Available Passenger Cruise Day in 2002 decreased 5.0% com-
pared to 2001. The decline on a per Available Passenger
Cruise Day basis was associated with fewer passengers pur-
chasing air passage through us and lower commissions result-
ing from reduced cruise ticket prices.
Marketing, selling and administrative expenses decreased 5.1%
to $431.1 million in 2002 compared to $454.1 million in 2001.
Marketing, selling and administrative expenses as a percentage
of revenues were 12.6% and 14.4% in 2002 and 2001, respec-
tively. Included in 2001 were charges associated with business
decisions taken subsequent to the events of September 11,
2001 involving itinerary changes, office closures and severance
costs related to a reduction in force. On a per Available
Passenger Cruise Day basis, marketing, selling and administra-
tive expenses in 2002 decreased 17.5% from 2001 primarily due
to economies of scale and cost reduction initiatives.
Net Cruise Costs per Available Passenger Cruise Day
decreased 2.2% in 2002 compared to 2001. The decrease in
2002 was primarily due to cost reduction initiatives subsequent
to the events of September 11, 2001.
Depreciation and amortization expenses increased 12.6% to
$339.1 million in 2002 from $301.2 million in 2001. The
increase was primarily due to incremental depreciation associ-
ated with the addition of new ships, partially offset by the elim-
ination of $10.4 million of goodwill amortization in 2002. (See
Note 2. Summary of Significant Accounting Policies.)
OTHER INCOME (EXPENSE)
Gross interest expense, was $290.3 million in 2002, essential-
ly unchanged from 2001. The increase in the average debt level
associated with our fleet expansion program was offset by a
decrease in interest rates. Capitalized interest decreased to
$23.4 million in 2002 from $37.0 million in 2001 due to a lower
average level of investment in ships under construction and
lower interest rates.
Included in other income (expense) in 2002 was $33.0 million
of net proceeds received in connection with the termination of
the P&O Princess merger agreement. Also included in other
income (expense) in 2002 and 2001 was $12.3 million and $7.2
million, respectively, of compensation from shipyards related to
the late delivery of ships.
LIQUIDITY AND CAPITAL RESOURCES
SOURCES AND USES OF CASH
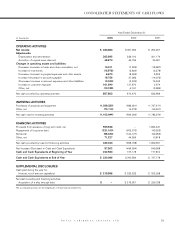
Net cash provided by operating activities was $857.8 million in
2003 compared to $870.5 million in 2002 and $633.7 million in
2001. The change in each year was primarily due to the timing
of cash receipts related to customer deposits and fluctuations
in net income.
During the year ended December 31, 2003, our capital expen-
ditures were approximately $1.0 billion compared to approxi-
mately $1.0 billion in 2002 and $2.1 billion in 2001. Capital
expenditures were primarily related to the deliveries of
Serenade of the Seas
and
Mariner of the Seas
in 2003;
Constellation
and
Navigator of the Seas
in 2002; and
Infinity
,
Radiance of the Seas
,
Summit
and
Adventure of the Seas
in
2001, as well as progress payments for ships under construc-
tion in all years.
Capitalized interest decreased to $15.9 million in 2003 from
$23.4 million in 2002 and $37.0 million in 2001 due to a lower
average level of investment in ships under construction and
lower interest rates.
ROYAL CARIBBEAN CRUISES LTD.
MANAGEMENT’S DISCUSSION AND ANALYSIS OF FINANCIAL
CONDITION AND RESULTS OF OPERATIONS (CONTINUED)