Ross 2010 Annual Report Download - page 4
Download and view the complete annual report
Please find page 4 of the 2010 Ross annual report below. You can navigate through the pages in the report by either clicking on the pages listed below, or by using the keyword search tool below to find specific information within the annual report.-
 1
1 -
 2
2 -
 3
3 -
 4
4 -
 5
5 -
 6
6 -
 7
7 -
 8
8 -
 9
9 -
 10
10 -
 11
11 -
 12
12 -
 13
13 -
 14
14 -
 15
15 -
16
-
17
-
18
-
19
-
20
-
21
-
22
-
23
-
24
-
25
-
26
-
27
-
28
-
29
-
30
-
31
-
32
-
33
-
34
-
35
-
36
-
37
-
38
-
39
-
40
-
41
-
42
-
43
-
44
-
45
-
46
-
47
-
48
-
49
-
50
-
51
-
52
-
53
-
54
-
55
-
56
-
57
-
58
-
59
-
60
-
61
-
62
-
63
-
64
-
65
-
66
-
67
-
68
-
69
-
70
-
71
-
72
-
73
-
74
 |
 |

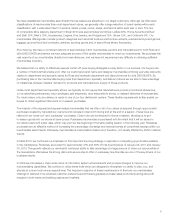
29%
25%
9%
12%
13%
12%
29% Ladies
25% Home Accents, Bed and Bath
13% Men’s
12% Accessories, Lingerie, Fine Jewelry, Fragrances
12% Shoes
9% Children’s
2
Our ongoing focus on bargains delivered another year of
record results for Ross Stores in 2010. This better-than-
expected fi nancial performance is even more noteworthy
considering it was on top of outstanding sales and earnings
gains in 2009.
2010 EPS Up 31% on Top of a 52% Gain in 2009
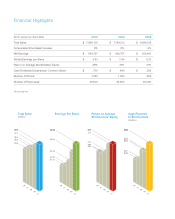
For the 52 weeks ended January 29, 2011, sales increased
9% to a record $7.9 billion, with same store sales up 5%
on top of a 6% gain in the prior year. Home, Dresses, and
Shoes were our top performing merchandise categories in
2010, with the Florida market posting the largest same store
sales gain.
Net earnings for the year grew 25% to a record $554.8
million, up from $442.8 million in 2009. Earnings per share
rose to $4.63, compared to $3.54 in the prior year. This
represented an exceptional gain of 31% on top of a 52%
increase in 2009. Operating margin in 2010 grew to a record
11.5%, up 140 basis points on top of a 250 basis point gain
in 2009. The main drivers of this signifi cant improvement
in profi tability were higher gross margin and increased
leverage on operating expenses from the healthy gain in
same store sales.
Strong Inventory Management Continues
to Drive Higher Margins
As we ended 2010, average in-store inventories were down
about 10% on top of double-digit declines in the prior two
years. We believe opportunities exist to further reduce in-
store inventories in 2011, with average store levels targeted
to be down in the mid-single-digit percentage range
compared to 2010.
Operating our business on lower inventory levels has
increased the percentage of fresh and exciting merchandise
our customers see when they shop our stores. By exceeding
our sales targets with leaner inventories, we also realized
signifi cantly faster turns in 2010, which resulted in lower
markdowns as a percent of sales and another year of record
merchandise gross margin.
The systems investments and new planning and allocation
processes we rolled out in 2009 continue to help us do a
better job of getting the right merchandise to the right store at
the right time. This is an iterative process that should enable
us to build on our successes and continue to enhance sales
productivity and profi tability going forward. We believe that
planning and allocating at a much more detailed level is
more important than ever, especially with less inventory in
our stores.
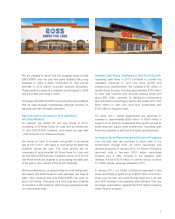
Expansion Accelerates at dd’s DISCOUNTS
During 2010, dd’s DISCOUNTS store growth accelerated
as we added 15 locations and entered two new states —
Nevada and Georgia. In addition, comparable stores at
dd’s DISCOUNTS posted respectable sales gains on top
of exceedingly strong increases in 2009. Like Ross, dd’s
DISCOUNTS has benefi ted from our ability to deliver a
faster fl ow of fresh and exciting product to our stores, while
operating on lower inventory levels. As a result, merchandise
gross margin in 2010 grew signifi cantly on top of record
levels in 2009.
To Our Stockholders