Ricoh 2007 Annual Report Download - page 9
Download and view the complete annual report
Please find page 9 of the 2007 Ricoh annual report below. You can navigate through the pages in the report by either clicking on the pages listed below, or by using the keyword search tool below to find specific information within the annual report.-
 1
1 -
 2
2 -
 3
3 -
 4
4 -
 5
5 -
 6
6 -
 7
7 -
 8
8 -
 9
9 -
 10
10 -
 11
11 -
 12
12 -
 13
13 -
 14
14 -
 15
15 -
 16
16 -
 17
17 -
 18
18 -
 19
19 -
 20
20 -
21
-
22
-
23
-
24
-
25
-
26
-
27
-
28
-
29
-
30
-
31
-
32
-
33
-
34
-
35
-
36
-
37
-
38
-
39
-
40
-
41
-
42
-
43
-
44
-
45
-
46
-
47
-
48
-
49
-
50
-
51
-
52
-
53
-
54
-
55
-
56
-
57
-
58
-
59
-
60
-
61
-
62
-
63
-
64
-
65
-
66
-
67
-
68
-
69
-
70
-
71
-
72
-
73
 |
 |

ANNUAL REPORT 2007
8
R e v i e w o f O p e r a t i o n s
Highlights
Business Strategy
Corporate Governance
CSR
Environmental Management
Brand Communications To Our Shareholders and
Customers
Financial Section
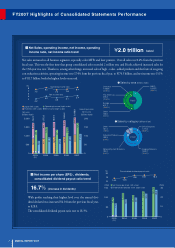
Total assets rose ¥202.2 billion from the previous fi scal year,
reaching ¥2,243.4 billion, due to increased accounts receivable
through business expansion, increased fi nance receivables, in-
creased inventory, and so on. Although interest-bearing liabili-
ties decreased thanks to strengthened cash management, busi-
ness investment procurement exceeded this and the result was
an increase of ¥34.3 billion from the previous period. Share-
holders’ equity was ¥1,070.9 billion, an increase of ¥110.6 bil-
lion from the previous fi scal year.
■
Total assets, shareholders’ equity, return on
assets, return on shareholders’ equity (ROE)
11.0%(ROE)
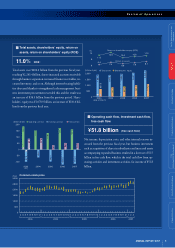
Net income, depreciation costs, and other internal reserves in-
creased from the previous fi scal year, but business investment
such as acquisition of shares in subsidiaries and increased assets
accompanying expanded business resulted in a decrease of ¥1.5
billion in free cash fl ow, which is the total cash fl ow from op-
erating activities and investment activities, for income of ¥51.8
billion.
■Operating cash fl ow, investment cash fl ow,
free cash fl ow
¥51.8 billion (free cash flow)
(%)
(billions of yen)
Return on shareholders’equity (ROE)
Return on assets
● Shareholders’ equity
B
●Total assets
A
11.2
6.4
12.6
7.4
10.0
6.9
10.6
7.6
11.0
8.1
0
500
1,000
1,500
2,000
2004 2005 2006 20072003
●
A●
B
1,884.9
1,852.7
1,953.6
2,041.1
2,243.4
657.5
795.1
862.9
960.2
1,070.9
6
9
12
(End of March)
(billions of yen) ●
Investing cash flow
B●
Free cash flow
C
●
Operating cash flow
A
0
50
-50
100
-100
150
200
2004
151.0
87.6
-63.4
2005
129.1
33.0
-96.0
2006
173.4
53.4
-120.0
2007
167.2
51.8
-115.4
2003
182.7
84.7
-97.9
●
A●
C
●
B
(FY)
(Yen)
3,000
2,500
2,000
1,500
1,000
500
0
2003 2004
4 12345678956789
10 11 12 10 11 12
2005
123456789
10 11 12
2006 2007
1 2 3 1 2 34 5 6 7 8 9
10 11 12
Common stock price