Ricoh 2007 Annual Report Download - page 8
Download and view the complete annual report
Please find page 8 of the 2007 Ricoh annual report below. You can navigate through the pages in the report by either clicking on the pages listed below, or by using the keyword search tool below to find specific information within the annual report.-
 1
1 -
 2
2 -
 3
3 -
 4
4 -
 5
5 -
 6
6 -
 7
7 -
 8
8 -
 9
9 -
 10
10 -
 11
11 -
 12
12 -
 13
13 -
 14
14 -
 15
15 -
 16
16 -
 17
17 -
 18
18 -
 19
19 -
20
-
21
-
22
-
23
-
24
-
25
-
26
-
27
-
28
-
29
-
30
-
31
-
32
-
33
-
34
-
35
-
36
-
37
-
38
-
39
-
40
-
41
-
42
-
43
-
44
-
45
-
46
-
47
-
48
-
49
-
50
-
51
-
52
-
53
-
54
-
55
-
56
-
57
-
58
-
59
-
60
-
61
-
62
-
63
-
64
-
65
-
66
-
67
-
68
-
69
-
70
-
71
-
72
-
73
 |
 |

ANNUAL REPORT 2007
7
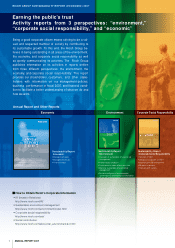
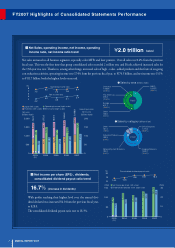
FY2007 Highlights of Consolidated Statements Performance
■Net Sales, operating income, net income, operating
income ratio, net income ratio trend ¥2.0 trillion(sales)
With profits reaching their highest level ever, the annual divi-
dend declared was increased ¥4.0 from the previous fiscal year,
to ¥28.0.
The consolidated dividend payout ratio rose to 18.3%.
■Net income per share (EPS) , dividends,
consolidated dividend payout ratio trend
16.7%
Net sales increased in all business segments, especially color MFPs and laser printers. Overall sales rose 8.4% from the previous
fiscal year. This was the first time that group consolidated sales exceeded 2 trillion yen, and Ricoh achieved increased sales for
the 13th year in a row. Thanks to, among other things, increased sales of high - value - added products and the fruits of on-going
cost reduction activities, operating income rose 17.4% form the previous fiscal year, to ¥174.3 billion, and net income rose 15.1%
to ¥111.7 billion, both the highest levels on record.
(increase in dividends)
(%)
(billions of yen) (billions of yen)
Operating income ratio
Net sales
Net income ratio
●Overseas (left scale)
B
●Operating income (right scale)
C
●Net income (right scale)
D
●Japan (left scale)
A
0
500
1,000
1,500
2,000
50
100
150
200
0
7.5
8.2
7.3 7.8 8.4
5.1 5.4
4.6
5.2
4.2
4
6
8
7
5
2003
1,732.0
889.6
129.7
72.5
842.3
●
A●
C●
D
●
B
2004
866.1 1,773.3
907.1
145.4
91.7
2005
841.1 1,807.4
966.2
83.1
131.1
2006
966.2 943.0 1,909.2
148.5
97.0
2007
1,066.6 2,068.9
1,002.2
174.3
111.7
Operating income
Net income
(FY)
Other
133.0
(6.5%)
Overseas
1,066.6
(51.6%)
The Americas
426.4
(20.6%)
Europe
507.1
(24.5%)
Japan
1,002.2
(48.4%)
●Sales by area (billions of yen)
Other
161.0
(7.8%)
FY2007
Imaging Solutions
1,580.1
(76.4%)
Network System Solutions
194.3
(9.4%)
Office Solutions
1,774.4
(85.8%)
Industrial Products
133.3
(6.4%)
●Sales by category (billions of yen)
FY2007
%
Consolidated dividend payout ratio
●
Dividends declared per share
(
right scale
)
●
Net Income per share
(
left scale
)
●
●
(FY)