Ricoh 2005 Annual Report Download - page 18
Download and view the complete annual report
Please find page 18 of the 2005 Ricoh annual report below. You can navigate through the pages in the report by either clicking on the pages listed below, or by using the keyword search tool below to find specific information within the annual report.-
 1
1 -
2
-
3
-
4
-
5
-
6
-
7
-
 8
8 -
 9
9 -
 10
10 -
 11
11 -
 12
12 -
 13
13 -
 14
14 -
 15
15 -
 16
16 -
 17
17 -
 18
18 -
 19
19 -
 20
20 -
 21
21 -
 22
22 -
 23
23 -
 24
24 -
 25
25 -
 26
26 -
 27
27 -
 28
28 -
29
-
30
-
31
-
32
-
33
-
34
-
35
-
36
-
37
-
38
-
39
-
40
-
41
-
42
-
43
-
44
-
45
-
46
-
47
-
48
-
49
-
50
-
51
-
52
-
53
-
54
-
55
-
56
-
57
-
58
-
59
-
60
 |
 |

Management's Discussion and Analysis of Fiscal 2005 Results
Revenues
In fiscal year 2005 ( extending from April 1, 2004 to March 31, 2005),
the Ricoh Group recorded consolidated net sales of ¥1,814.1 billion
( $16,954 million) , or up 1.9% from the previous fiscal year. This
marks the eleventh consecutive fiscal year of year-on-year revenue
growth. During the term under review, the average exchange rates of
the yen against the U.S. dollar and the euro were ¥107.58 ( up ¥5.51)
and ¥135.25 ( down ¥2.60), respectively. Excluding the effects of these
foreign exchange rate fluctuations, consolidated net sales increased
2.4% from the previous fiscal year.
In terms of domestic market, sales increased for printing systems such
as MFPs ( multifunction printers) and laser printers. Ricoh Printing
Systems, Ltd., our newly acquired printer company, contributed to the
sales increase. Our solutions business such as customer support and
service also delivered favorable performance. As a result, overall sales
of office equipment increased 5.0% from the previous corresponding
period. While other businesses suffered from sluggish demand for
semiconductors and lower demand period for measuring equipment,
such businesses as optical equipment maintained strength.
Consequently, overall domestic sales increased 6.4% to ¥972.9 billion
( $9,093 million) . Domestic sales accounted for 53.6% of consolidated
net sales, or up 2.3 percentage points.
In terms of overseas, sales decreased in the Americas due to the yen’s
appreciation against the U.S. dollar. In Europe, on the other hand,
sales kept strong gains. In other areas, sales decreased as we sold
consolidated subsidiaries in optical-related analog businesses. By
product category, sales proceeds from our core products ( color PPCs
and printing systems) increased to compensate for part of the sales
declines in standalone analog equipment and optical discs. Due to the
aforementioned sale of businesses and the relative yen’s appreciation,
overseas sales decreased 2.9% from the previous corresponding period
to ¥841.1 billion ( $7,861 million) . Excluding the effects of foreign
exchange rate fluctuations, overseas sales increased 1.9%. Overseas
sales accounted for 46.4% of consolidated net sales, or down 2.3
percentage points.
Oper ating Income
Gross profit decreased 1.4% from the previous corresponding period to
¥754.5 billion ( $7,052 million) . Although sales increased in such
high-margin, high value added products as MFPs and laser printers
and the ongoing cost-cutting efforts contributed to gross profit, the
sales promotion of color models in the first half of the term under
review, downsizing of the optical disc business, the aforementioned sale
of businesses, and the yen’s appreciation had a negative effect on gross
profit.
Selling, general and administrative expenses decreased by 0.8% to
¥619.0 billion ( $5,786 million) from the previous corresponding
period. Ricoh increased its research and development investments by
19.4% to ¥110.4 billion ( $1,033 million) from the previous
17 ANNUAL REPORT 2005
SALES BY PRODUCT LINE
2004
2005
Percentage of Percentage of Thousands of
Millions of yen net sales Millions of yen net sales U.S.dollars
Office Equipment
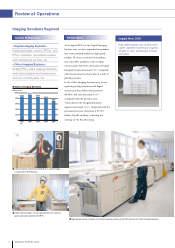
Imaging Solutions ¥ 803,574 45.1%
¥ 715,097 39.4% $ 6,683,150
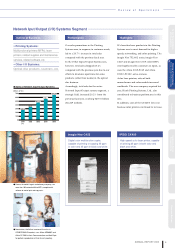
Network Input/Output Systems 558,237 31.4
670,836 37.0 6,269,495
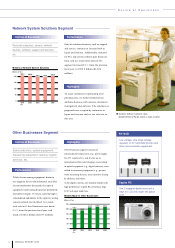
Network System Solutions 195,822 11.0
205,895 11.3 1,924,252
Other Businesses
222,612 12.5
222,280 12.3 2,077,383
Total ¥1,780,245 100.0%
¥1,814,108 100.0% $ 16,954,280
SALES BY GEOGRAPHIC AREA
2004
2005
Percentage of Percentage of Thousands of
Millions of yen net sales Millions of yen net sales U.S.dollars
Japan ¥ 914,060 51.3%
¥ 972,975 53.6% $ 9,093,224
The Americas 326,380 18.3
325,597 17.9 3,042,963
Europe 402,392 22.6
408,906 22.5 3,821,551
Other 137,413 7.8
106,630 6.0 996,542
Total ¥1,780,245 100.0%
¥1,814,108 100.0% $ 16,954,280