Redbox 2002 Annual Report Download - page 9
Download and view the complete annual report
Please find page 9 of the 2002 Redbox annual report below. You can navigate through the pages in the report by either clicking on the pages listed below, or by using the keyword search tool below to find specific information within the annual report.-
 1
1 -
 2
2 -
 3
3 -
 4
4 -
 5
5 -
 6
6 -
 7
7 -
 8
8 -
 9
9 -
 10
10 -
 11
11 -
 12
12
 |
 |

{7}
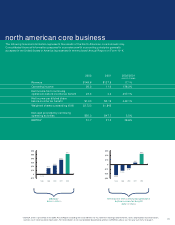
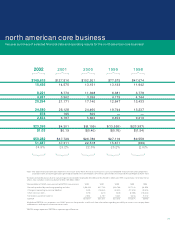
$149,615 $127,816 $102,201 $77,575 $47,674
15,436 14,575 13,151 13,133 11,942
8,221 8,770 11,368 6,381 3,778
4,931 3,962 3,266 4,179 4,744
20,294 21,171 17,140 12,647 13,433
24,580 26,128 24,460 19,744 13,237
878 195 505 — —
2,834 6,787 5,662 9,453 9,210
$23,395 $4,201 $(8,109) $(13,526) $(23,387)
$1.03 $0.19 $(0.40) $(0.76) $(1.54)
$50,282 $47,729 $26,786 $27,116 $9,558
51,687 37,311 22,518 15,671 (940)
34.5% 29.2% 22.0% 20.2% (2.0)%
2002 2001 2000 1999 1998
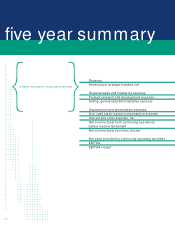
five year summary of selected financial data and operating results for the north american core business1
northamerican core business
Net cash provided by continuing operating activities
Changes in operating assets and liabilities
Other non-cash items
Net interest and other expense
EBITDA
We believe EBITDA is an important non-GAAP measure that provides useful cash flow information regarding our ability to service, incur or pay down
indebtedness and repurchase our common stock.
$ 50,282 $47,729 $26,786 $27,116 $9,558
(510) (16,884) (8,992) (11,913) (9,325)
(919) (321) (938) (8,985) (10,383)
2,834 6,787 5,662 9,453 9,210
$51,687 $37,311 $22,518 $15,671 $(940)
2Excludes extraordinary loss due to early extinguishment of debt totaling $3,942,000 and $3,250,00 in 2002 and 1999, respectively, net of income tax
effect. Also excludes income tax benefit of $40,189,000 in 2002.
4EBITDA margin represents EBITDA as a percentage of Revenue.
1Note: The above financial information represents the results of the North American core business only. Consolidated financial information prepared in
accordance with accounting principles generally accepted in the United States of America is presented in the enclosed Annual Report on Form 10-K.
3Reconciliation of GAAP measurement to EBITDA measurement. 2002 2001 2000 1999 1998