Redbox 2002 Annual Report Download - page 5
Download and view the complete annual report
Please find page 5 of the 2002 Redbox annual report below. You can navigate through the pages in the report by either clicking on the pages listed below, or by using the keyword search tool below to find specific information within the annual report.-
 1
1 -
 2
2 -
 3
3 -
 4
4 -
 5
5 -
 6
6 -
 7
7 -
 8
8 -
 9
9 -
 10
10 -
 11
11 -
 12
12
 |
 |
{3}
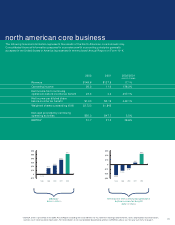
-$10
0
$10
$20
$30
$40
$50
$60
1998 1999 2000 2001 2002
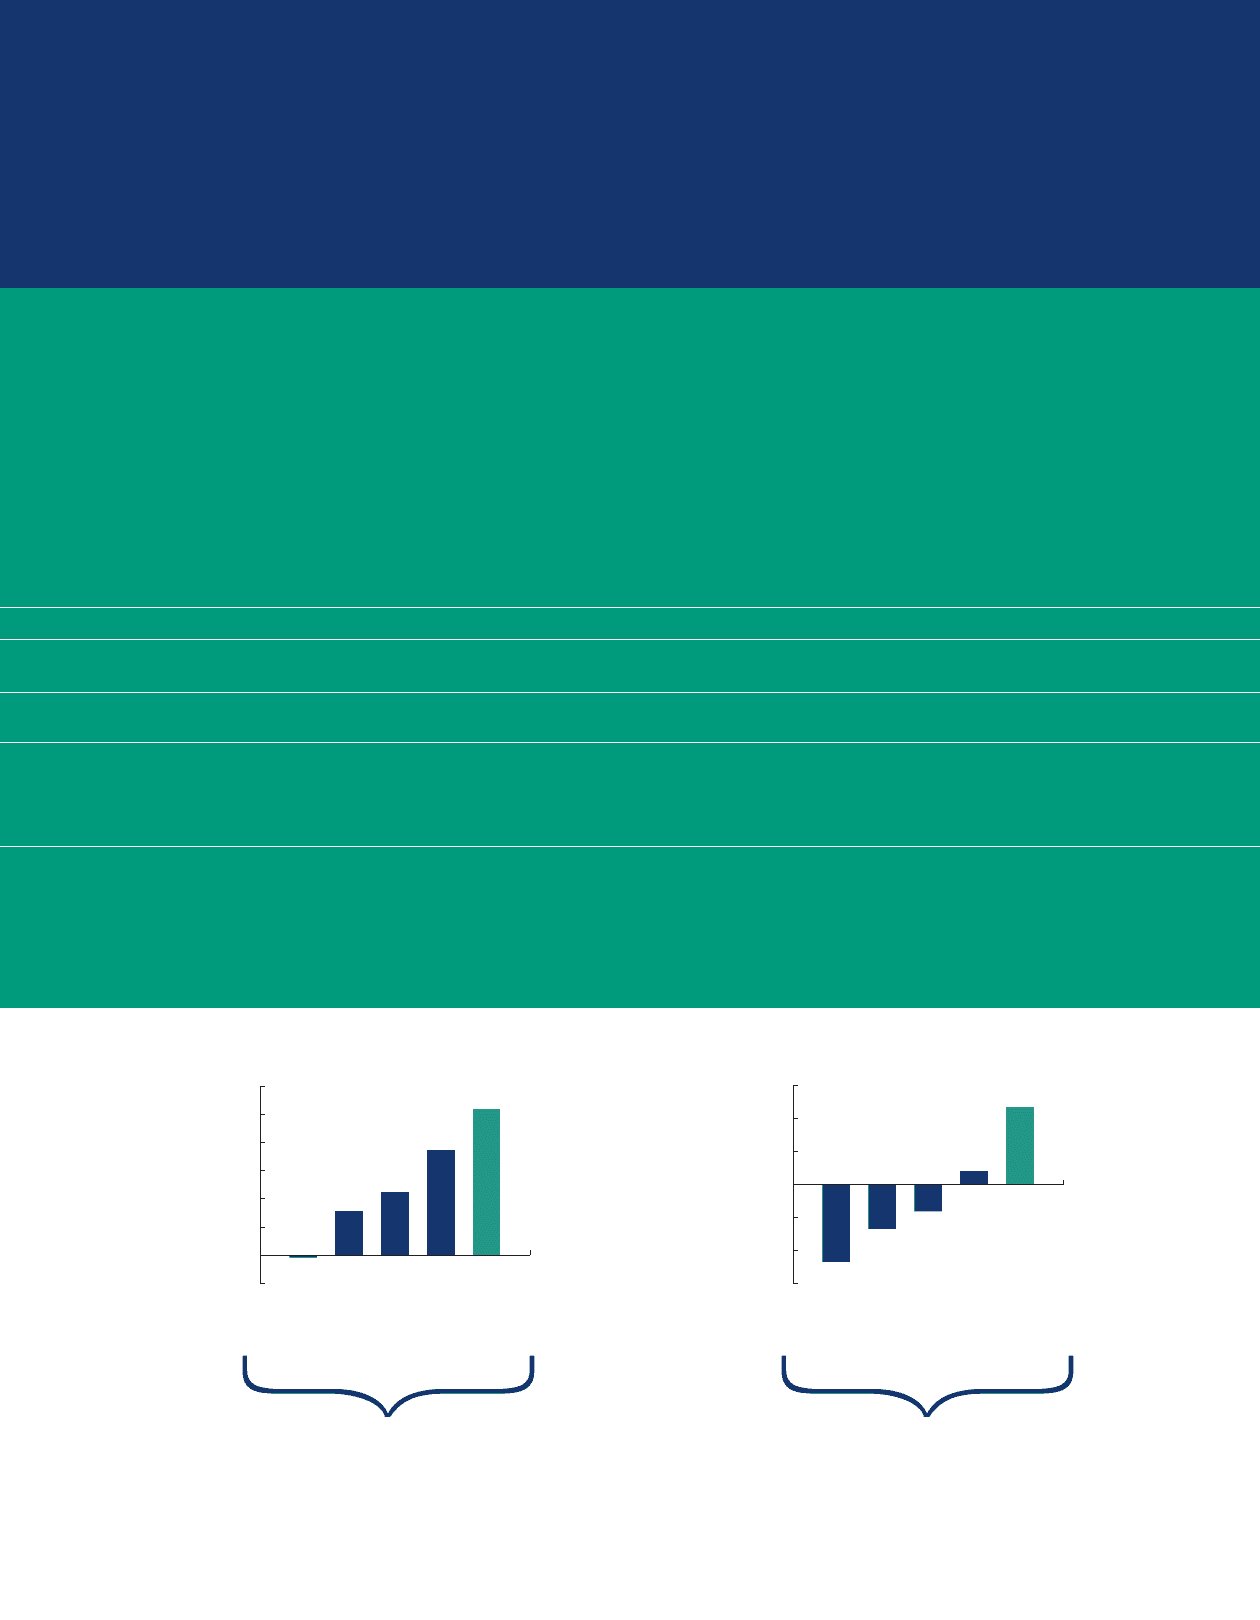
$23.4
$4.2
$-8.1
$-13.5
$-23.4
-$30
-$20
-$10
0
$10
$20
$30
1998 1999 2000 2001 2002
$51.7
$37.3
$22.5
$15.7
$-0.9
* EBITDA, which is presented in this 2002 Annual Report (including the enclosed Form 10-K), represents earnings before interest, taxes, depreciation and amortization,
and non-cash stock-based compensation. For reconciliation of net cash provided by operating activities to EBITDA, please see “five year summary” on page 7.
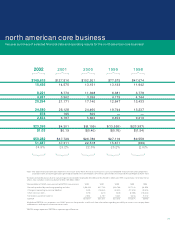
The following financial information represents the results of the North American core business only.
Consolidated financial information prepared in accordance with accounting principles generally
accepted in the United States of America is presented in the enclosed Annual Report on Form 10-K.
EBITDA
*
(dollars in millions)
Net Income from continuing operations
before income tax benefit
(dollars in millions)
2002 2001 2002/2001
percent change
Revenue $149.6 $127.8 17.1%
Operating income 26.2 11.0 138.2%
Net income from continuing
operations before income tax benefit 23.4 4.2 457.1%
Net income per diluted share
before income tax benefit $1.03 $0.19 442.1%
Weighted shares outstanding (000) 22,723 21,845
Net cash provided by continuing
operating activities $50.3 $47.7 5.5%
EBITDA* 51.7 37.3 38.6%
northamerican core business