Quest Diagnostics 1999 Annual Report Download - page 2
Download and view the complete annual report
Please find page 2 of the 1999 Quest Diagnostics annual report below. You can navigate through the pages in the report by either clicking on the pages listed below, or by using the keyword search tool below to find specific information within the annual report.-
 1
1 -
 2
2 -
 3
3 -
 4
4 -
 5
5 -
 6
6 -
 7
7 -
 8
8 -
 9
9 -
 10
10 -
 11
11 -
 12
12 -
 13
13 -
14
-
15
-
16
 |
 |

Quest Diagnostics is the nation’s leading provider of diagnostic testing, information and
services with annualized revenues of more than $3 billion. The testing performed on
human specimens helps doctors diagnose, treat and monitor disease; enables employers
to detect workplace drug abuse; and supports pharmaceutical and biotechnology
companies in clinical trials of new therapeutics worldwide. Quest Informatics analyzes
laboratory and other medical data to help health care providers improve the care of patients,
and offers a range of Internet-based health and information services to physicians, hospitals
and consumers.
OUR BUSINESS
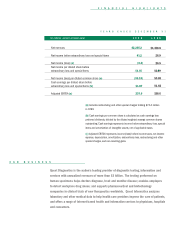
YEARS ENDED DECEMBER 31
FINANCIAL HIGHLIGHTS
1999 1998
Net revenues $2,205.2
Net income before extraordinary loss and special items 41.2
Net income (loss) (a) (3.4)
Net income per diluted share before
extraordinary loss and special items $1.15
Net income (loss) per diluted common share (a) ($0.10)
Cash earnings per diluted share before
extraordinary loss and special items (b) $1.87
Adjusted EBITDA (c) 237.0
(a) Includes restructuring and other special charges totaling $73.4 million
in 1999.
(b) Cash earnings per common share is calculated as cash earnings less
preferred dividends, divided by the diluted weighted average common shares
outstanding. Cash earnings represents income before extraordinary loss, special
items and amortization of intangible assets, net of applicable taxes.
(c) Adjusted EBITDA represents income (loss) before income taxes, net interest
expense, depreciation, amortization, extraordinary loss, restructuring and other
special charges, and non-recurring gains.
$1,458.6
26.9
26.9
$0.89
$0.89
$1.48
158.6
(in millions, except per share data)