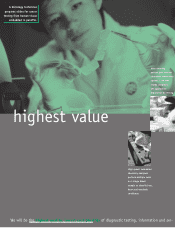
Quest Diagnostics 1997 Annual Report Download - page 3
Download and view the complete annual report
Please find page 3 of the 1997 Quest Diagnostics annual report below. You can navigate through the pages in the report by either clicking on the pages listed below, or by using the keyword search tool below to find specific information within the annual report.-
 1
1 -
 2
2 -
 3
3 -
 4
4 -
 5
5 -
 6
6 -
 7
7 -
 8
8 -
 9
9 -
 10
10 -
 11
11 -
 12
12 -
 13
13 -
 14
14 -
15
-
16
-
17
-
18
-
19
-
20
 |
 |

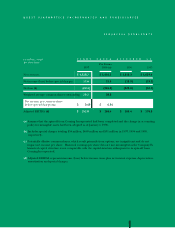
Net revenues $ 1,528.7 $ 1,616.3 $ 1,616.3 $ 1,629.4
Net income (loss) before special charges 17.6 15.6 (15.9) (19.2)
Net loss (b) (22.3) (594.5) (626.0) (52.1)
Weighted average common shares outstanding 29.2 28.8
Net income per common share
before special charges (c) $ 0.60 $ 0.54
Adjusted EBITDA (d) $ 153.8 $ 166.4 $ 166.4 $ 176.5
(a) Assumes that the spin-off from Corning Incorporated had been completed and the change in accounting
policy for intangible assets had been adopted as of January 1, 1996.
(b) Includes special charges totaling $56 million, $669 million and $51 million in 1997, 1996 and 1995,
respectively.
(c) Potentially dilutive common shares, which result primarily from options, are insignificant and do not
impact net income per share. Historical earnings per share data are not meaningful as the CompanyÕs
historical capital structure is not comparable with the capital structure subsequent to its spin-off from
Corning Incorporated.
(d) Adjusted EBITDA represents income (loss) before income taxes plus net interest expense, depreciation,
amortization and special charges.
QUEST DIAGNOSTICS INCORPORATED AND SUBSIDIARIES
FINANCIAL HIGHLIGHTS
(in millions, except
per share data) Pro Forma
1997 1996 (a) 1996 1995
YEARS ENDED DECEMBER 31
1