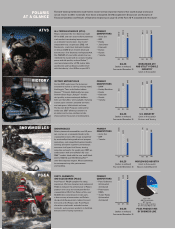
Polaris 2006 Annual Report Download - page 14
Download and view the complete annual report
Please find page 14 of the 2006 Polaris annual report below. You can navigate through the pages in the report by either clicking on the pages listed below, or by using the keyword search tool below to find specific information within the annual report.-
 1
1 -
2
-
3
-
 4
4 -
 5
5 -
 6
6 -
 7
7 -
 8
8 -
 9
9 -
 10
10 -
 11
11 -
 12
12 -
 13
13 -
 14
14 -
 15
15 -
 16
16 -
 17
17 -
 18
18
 |
 |

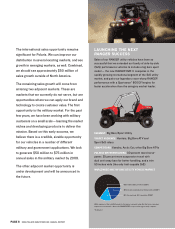
PAGE 10 2006 POLARIS INDUSTRIES INC. ANNUAL REPORT
The selected financial data presented below are qualified in their entirety by, and should be read in conjunction with, the Consolidated Financial Statements
and Notes thereto and other financial and statistical information, including the information referenced under the caption “Management’s Discussion and
Analysis of Financial Condition and Results of Operation,” located in the Form 10-K included in this report.
Prior years’ results have been adjusted to reflect the adoption of SFAS 123(R) under the modified retrospective method.
For the Years Ended December 31, 2006 2005 2004 2003
STATEMENT OF OPERATIONS DATA
Sales data:
Total sales $1,656,518 $1,869,819 $1,773,206 $1,552,351
Percent change from prior year (11%) 5% 14% 6%
Sales mix by product:
All-terrain vehicles 67% 66% 66% 67%
Snowmobiles 10% 14% 16% 15%
Motorcycles 7% 5% 4% 4%
Parts, garments & accessories 16% 15% 14% 14%
Gross profit data:
Total gross profit $359,359 $411,032 $416,600 $355,961
Percent of sales 22% 22% 23% 23%
Operating expense data:
Total operating expenses $238,363 $244,660 $242,690 $206,013
Percent of sales 14% 13% 14% 13%
Net income data:
Net income from continuing operations $112,791 $137,721 $132,257 $115,178
Diluted net income per share from continuing operations $2.72 $3.15 $2.97 $2.58
Net income $106,985 $136,714 $99,948 $106,284
Diluted net income per share $2.58 $3.12 $2.25 $2.38
CASH FLOW DATA
Cash flow from continuing operating activities $152,754 $162,463 $237,061 $162,540
Purchase of property and equipment for continuing operations 52,636 89,770 88,836 59,209
Repurchase and retirement of common stock 307,621 132,280 66,830 73,125
Cash dividends to shareholders 50,234 46,956 38,856 26,657
Cash dividends per share $1.24 $1.12 $0.92 $0.62
BALANCE SHEET DATA
(at end of year)
Cash and cash equivalents $19,566 $19,675 $138,469 $82,761
Current assets 392,961 373,988 465,655 387,716
Total assets 778,791 770,633 792,925 674,178
Current liabilities 361,420 375,614 405,193 330,478
Borrowings under credit agreements 250,000 18,000 18,000 18,008
Shareholders’ equity 167,371 377,019 368,058 325,692
(1) In 1998, Polaris entered into a settlement agreement related to a trade secret infringement claim brought by Injection Research Specialists, Inc. The one-time provision for litigation loss amounted to
$61.4 million pretax, or $0.77 per diluted share in 1998. The settlement had no effect on the future operations of the Company. Excluding this charge, other operating expenses, net income and diluted
net income per share from continuing operations for 1998 would have been $98.0 million, $76.7 million and $1.48 per share, respectively.
NOTE: All periods presented reflect the classification of the marine products division’s financial results, including the loss from discontinued operations and the loss on disposal of the division,
as discontinued operations.
11-YEAR SELECTED FINANCIAL DATA (in thousands, except per share and per unit data)