Pitney Bowes 2006 Annual Report Download - page 34
Download and view the complete annual report
Please find page 34 of the 2006 Pitney Bowes annual report below. You can navigate through the pages in the report by either clicking on the pages listed below, or by using the keyword search tool below to find specific information within the annual report.-
 1
1 -
2
-
3
-
4
-
5
-
6
-
7
-
8
-
9
-
10
-
11
-
12
-
13
-
14
-
15
-
16
-
17
-
18
-
19
-
20
-
21
-
22
-
23
-
 24
24 -
 25
25 -
 26
26 -
 27
27 -
 28
28 -
 29
29 -
 30
30 -
 31
31 -
 32
32 -
 33
33 -
 34
34 -
 35
35 -
 36
36 -
 37
37 -
 38
38 -
 39
39 -
 40
40
 |
 |

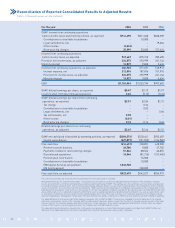
Reconciliation of Reported Consolidated Results to Adjusted Results
Dollars in thousands, except per share amounts
32
For the year 2006 2005 2004
GAAP income from continuing operations
before income taxes and minority interest, as reported $914,490 $811,668 $608,390
Contributions to charitable foundations – 10,000 –
Legal settlements, net – – 19,666
Other income (3,022) ––
Restructuring charges 35,999 53,650 157,634
Income from continuing operations
before income taxes, as adjusted 947,467 875,318 785,690
Provision for income taxes, as adjusted 326,875 293,999 261,144
Minority interest 13,827 9,828 5,634
Income from continuing operations, as adjusted 606,765 571,491 518,912
Interest expense, net 212,596 187,876 157,993
Provision for income taxes, as adjusted 326,875 293,999 261,144
Minority interest 13,827 9,828 5,634
EBIT $1,160,063 $1,063,194 $943,683
GAAP diluted earnings per share, as reported $0.47 $2.19 $1.97
Loss (income) from discontinued operations 2.04 (0.15) (0.24)
GAAP diluted earnings per share from continuing
operations, as reported $2.51 $2.04 $1.73
Tax charge – 0.24 –
Contributions to charitable foundations – 0.03 –
Legal settlements, net – – 0.06
Tax settlements, net 0.09 ––
Other income (0.01) ––
Restructuring charges 0.10 0.16 0.43
Diluted earnings per share from continuing
operations, as adjusted $2.69 $2.46 $2.22
GAAP net cash (used in) provided by operating activities, as reported $(286,574) $530,441 $935,487
Capital expenditures (327,877) (291,550) (316,982)
Free cash flow (614,451) 238,891 618,505
Reserve account deposits 28,780 9,800 27,782
Payments related to restructuring charges 51,566 88,544 66,055
Discontinued operations 16,844 (81,216) (157,405)
Pension plan contribution – 76,508 –
Contributions to charitable foundations – 10,000 –
IRS/Capital Services tax payment 1,040,700 ––
IRS bond payment – 200,000 –
Free cash flow, as adjusted $523,439 $542,527 $554,937
The sum of the earnings per share amounts may not equal the totals above due to rounding.
Management believes this presentation provides a reasonable basis on which to present the adjusted financial information. The Company’s financial
results are reported in accordance with generally accepted accounting principles (GAAP). The earnings per share and free cash flow results are adjusted
to exclude the impact of special items such as restructuring charges and write-downs of assets, which materially impact the comparability of the Company’s
results of operations. The use of free cash flow has limitations. GAAP cash flow has the advantage of including all cash available to the Company after actual
expenditures for all purposes. Free cash flow is the amount of cash that management could have available for discretionary uses if it made different decisions
about employing its cash. It adds back long-term commitments such as capital expenditures and pension plan contributions, as well as special items such
as charitable contributions and cash used for restructuring charges. All of these items use cash that is not otherwise available to the Company and are
important expenditures. Management compensates for these limitations by using a combination of GAAP cash flow and free cash flow in doing its planning.
The adjusted financial information and certain financial measures such as EBIT and EBIT to interest are intended to be more indicative of the ongoing
operations and economic results of the Company. EBIT excludes interest and taxes, and as a result has the effect of showing a greater amount of earnings
than net income. The Company believes that interest and taxes, though important, do not reflect management effectiveness as these items are largely
outside of their control. In assessing performance, the Company uses both EBIT and net income.
This adjusted financial information should not be construed as an alternative to our reported results determined in accordance with GAAP. Further, our
definition of this adjusted financial information may differ from similarly titled measures used by other companies.