Pitney Bowes 2006 Annual Report Download - page 33
Download and view the complete annual report
Please find page 33 of the 2006 Pitney Bowes annual report below. You can navigate through the pages in the report by either clicking on the pages listed below, or by using the keyword search tool below to find specific information within the annual report.-
 1
1 -
2
-
3
-
4
-
5
-
6
-
7
-
8
-
9
-
10
-
11
-
12
-
13
-
14
-
15
-
16
-
17
-
18
-
19
-
20
-
21
-
22
-
 23
23 -
 24
24 -
 25
25 -
 26
26 -
 27
27 -
 28
28 -
 29
29 -
 30
30 -
 31
31 -
 32
32 -
 33
33 -
 34
34 -
 35
35 -
 36
36 -
 37
37 -
 38
38 -
 39
39 -
 40
40
 |
 |

31
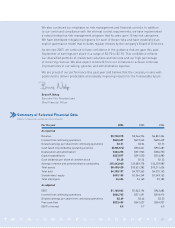
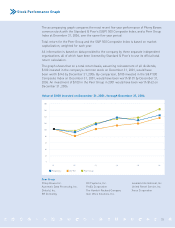
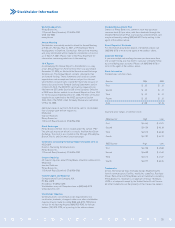
Summary of Selected Financial Data
Dollars in thousands, except per share amounts
We also continued our emphasis on risk management and financial controls. In addition
to our continued compliance with the internal control requirements, we have implemented
a robust enterprise risk management program that focuses upon 15 key risk categories.
We have developed mitigation programs for each of these risks and have established an
explicit governance model that includes regular reviews by the company’s Board of Directors.
As we view 2007, we continue to have confidence in the guidance that we gave this past
September of earnings per share in a range of $2.90 to $2.98. This confidence reflects
our diversified portfolio of mailstream solutions and services and our high percentage
of recurring revenue. We also expect to benefit from our initiatives to achieve continual
improvements in our selling, general, and administrative expense.
We are proud of our performance this past year and believe that the company is very well-
positioned to deliver predictable and steadily improving results for the foreseeable future.
Bruce P. Nolop
Executive Vice President and
Chief Financial Officer
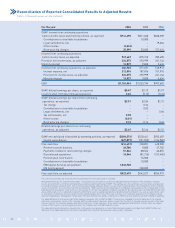
For the year 2006 2005 2004
As reported
Revenue $5,730,018 $5,366,936 $4,832,304
Income from continuing operations $565,659 $473,243 $405,439
Diluted earnings per share from continuing operations $2.51 $2.04 $1.73
Cash (used in) provided by operating activities $(286,574) $530,441 $935,487
Depreciation and amortization $363,258 $331,963 $306,750
Capital expenditures $327,877 $291,550 $316,982
Cash dividends per share of common stock $1.28 $1.24 $1.22
Average common and potential shares outstanding 225,443,060 232,089,178 234,229,987
Total assets $8,480,420 $10,621,382 $10,211,626
Total debt $4,338,157 $4,707,365 $4,375,163
Stockholders’ equity $699,189 $1,364,249 $1,349,152
Total employees 34,454 34,165 35,183
As adjusted
EBIT $1,160,063 $1,063,194 $943,683
Income from continuing operations $606,765 $571,491 $518,912
Diluted earnings per share from continuing operations $2.69 $2.46 $2.22
Free cash flow $523,439 $542,527 $554,937
EBIT to interest 5.5 5.7 6.0