Omron 2003 Annual Report Download - page 3
Download and view the complete annual report
Please find page 3 of the 2003 Omron annual report below. You can navigate through the pages in the report by either clicking on the pages listed below, or by using the keyword search tool below to find specific information within the annual report.-
 1
1 -
 2
2 -
 3
3 -
 4
4 -
 5
5 -
 6
6 -
 7
7 -
 8
8 -
 9
9 -
 10
10 -
 11
11 -
 12
12 -
 13
13 -
 14
14 -
15
-
16
-
17
-
18
-
19
-
20
-
21
-
22
-
23
-
24
-
25
-
26
-
27
-
28
-
29
-
30
-
31
-
32
-
33
-
34
-
35
-
36
-
37
-
38
-
39
-
40
-
41
-
42
-
43
-
44
-
45
-
46
-
47
-
48
-
49
-
50
-
51
-
52
-
53
-
54
-
55
-
56
-
57
-
58
 |
 |

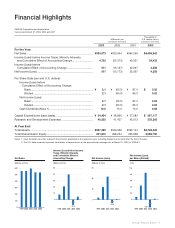
Financial Highlights
Net Sales
(Billions of Yen)
Income (Loss) before Income
Taxes, Minority Interests
and Cumulative Effect of
Accounting Change
(Billions of Yen)
Net Income (Loss)
(Billions of Yen)
Net Income (Loss)
per Share (Diluted)
(Yen)
0
100
200
300
400
500
600
1999 2000 2001 2002 2003
0
10
-25.4
20
30
40
50
1999 2000 2001 2002 2003
-15.8
0
10
20
30
1999 2000 2001 2002 2003
OMRON Corporation and Subsidiaries
Years ended March 31, 2003, 2002 and 2001
Thousands of
Millions of yen U.S. dollars (Note 2)
(except per share data) (except per share data)
2003 2002 2001 2003
For the Year:
Net Sales.......................................................................................
¥535,073 ¥533,964 ¥594,259 $4,458,942
Income (Loss) before Income Taxes, Minority Interests
and Cumulative Effect of Accounting Change...........................
4,732 (25,373) 40,037 39,433
Income (Loss) before
Cumulative Effect of Accounting Change..................................
511 (16,157) 22,297 4,258
Net Income (Loss) .........................................................................
511 (15,773) 22,297 4,258
Per Share Data (yen and U.S. dollars):
Income (Loss) before
Cumulative Effect of Accounting Change
Basic.................................................................................
¥ 2.1 ¥ (65.0) ¥ 87.4 $0.02
Diluted ..............................................................................
2.1 (65.0) 85.3 0.02
Net Income (Loss)
Basic.................................................................................
2.1 (63.5) 87.4 0.02
Diluted ..............................................................................
2.1 (63.5) 85.3 0.02
Cash Dividends (Note 1) .........................................................
10.0 13.0 13.0 0.08
Capital Expenditures (cash basis).................................................
¥ 34,454 ¥ 38,896 ¥ 37,583 $ 287,117
Research and Development Expenses .........................................
40,235 41,407 42,513 335,292
At Year End:
Total Assets...................................................................................
¥567,399 ¥549,366 ¥593,144 $4,728,325
Total Shareholders’ Equity ............................................................
251,610 298,234 325,958 2,096,750
Notes: 1. Cash dividends per share represent the amounts applicable to the respective year, including dividends to be paid after the end of the year.
2. The U.S. dollar amounts represent translations of Japanese yen at the approximate exchange rate at March 31, 2003, of ¥120=$1.
-63.5
0
20
40
60
80
100
1999 2000 2001 2002 2003
Annual Report 2003 • 1