O'Reilly Auto Parts 2005 Annual Report Download - page 2
Download and view the complete annual report
Please find page 2 of the 2005 O'Reilly Auto Parts annual report below. You can navigate through the pages in the report by either clicking on the pages listed below, or by using the keyword search tool below to find specific information within the annual report.-
 1
1 -
 2
2 -
 3
3 -
 4
4 -
 5
5 -
 6
6 -
 7
7 -
 8
8 -
 9
9 -
 10
10 -
 11
11 -
 12
12 -
 13
13 -
14
-
15
-
16
-
17
-
18
-
19
-
20
-
21
-
22
-
23
-
24
-
25
-
26
-
27
-
28
-
29
-
30
-
31
-
32
-
33
-
34
-
35
-
36
-
37
-
38
-
39
-
40
-
41
-
42
-
43
-
44
-
45
-
46
-
47
-
48
-
49
-
50
-
51
-
52
-
53
-
54
-
55
-
56
 |
 |

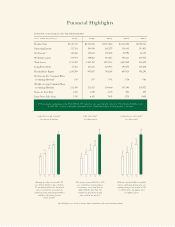
Financial Highlights
In thousands, except earnings per share data and operating data
years ended december 31 2005 2004 2003 2002 2001
Product Sales $2,045,318 $1,721,241 $1,511,816 $1,312,490 $1,092,112
Operating Income 252,524 190,458 165,275 138,301 113,831
Net Income(a) 164,266 117,674 100,087 81,992 66,352
Working Capital 424,974 479,662 441,617 483,623 429,527
Total Assets 1,713,899 1,432,357 1,157,033 1,009,419 856,859
Long-Term Debt 25,461 100,322 120,977 190,470 165,618
Shareholders' Equity 1,145,769 947,817 784,285 650,524 556,291
Net Income Per Common Share
(assuming dilution)(a) 1.45 1.05 0.92 0.76 0.63
Weight-Average Common Share
(assuming dilution) 113,385 111,423 109,060 107,384 105,572
Stores At Year-End 1,470 1,249 1,109 981 875
Same-Store Sales Gain 7.5% 6.8% 7.8% 3.7% 8.8%
Earnings per share increased 38.1%
over 2004 to $1.45 per share. On June
15, our Board of Directors declared a
2-for-1 stock split as a result of our
continued strong financial performance
and their expectations for our
future growth.
earnings per share(a)
(assuming dilution)
With our continued efforts to control
expenses while also driving sales, our
operating margin increased to 12.3%
in 2005 which is the highest level
in company history.
operating income(a)
(in thousands)
Net income increased 39.6% in 2005
as a result of our continued focus
on customer service and drive to
make O'Reilly Auto Parts the
number one distributor of auto
parts in all of our markets.
net income(a)
(in thousands)
(a) 2004 figures are based on income before cumulative effect of accounting change.
01
0.63
0.76
0.92
1.05
1.45
02 03 04 05 01
66,352
81,992
100,087
117,674
164,266
02 03 04 05 01
113,831
138,301
165,275
190,458
252,524
02 03 04 05
2005 was another outstanding year for Team O'Reilly. We reached our sales goal originally set back in 2002 of having $2 billion in sales
by 2005. This is a direct result of the commitment of over 19,000 team members working together as one team.