North Face 2014 Annual Report Download - page 33
Download and view the complete annual report
Please find page 33 of the 2014 North Face annual report below. You can navigate through the pages in the report by either clicking on the pages listed below, or by using the keyword search tool below to find specific information within the annual report.-
 1
1 -
2
-
3
-
4
-
5
-
6
-
7
-
8
-
9
-
10
-
11
-
12
-
13
-
14
-
15
-
16
-
17
-
18
-
19
-
20
-
21
-
22
-
 23
23 -
 24
24 -
 25
25 -
 26
26 -
 27
27 -
 28
28 -
 29
29 -
 30
30 -
 31
31 -
 32
32 -
 33
33 -
 34
34 -
 35
35 -
 36
36
 |
 |

31
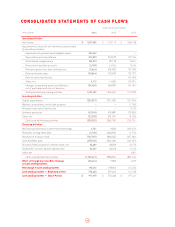
CONSOLIDATED STATEMENTS OF CASH FLOWS
YEAR ENDED DECEMBER
In thousands 2014 2013 2012
Operating Activities
Net income $ 1,047,505 $ 1,210,119 $ 1,086,138
Adjustments to reconcile net income to cash provided
by operating activities:
Impairment of goodwill and intangible assets 396,362 – –
Depreciation and amortization 274,883 253,273 237,956
Stock-based compensation 104,313 87,118 92,814
Provision for doubtful accounts (2,198) 15,756 19,264
Pension expense less than contributions (9,864) (28,102) (20,198)
Deferred income taxes (78,064) (12,370) (20,797)
Gain on sale of businesses ––(44,485)
Other, net 4,112 14,306 (40,931)
Changes in operating assets and liabilities,
net of purchases and sales of business
(39,420) (34,059) (34,761)
Cash provided by operating activities 1,697,629 1,506,041 1,275,000
Investing Activities
Capital expenditures (234,077) (271,153) (251,940)
Business acquisitions, net of cash acquired ––(1,750)
Proceeds from sale of businesses ––72,519
Software purchases (67,943) (53,989) (30,890)
Other, net (27,235) (25,131) (8,230)
Cash used by investing activities (329,255) (350,273) (220,291)
Financing Activities
Net increase (decrease) in short-term borrowings 4,761 9,032 (269,010)
Payments on long-term debt (4,760) (404,872) (2,776)
Purchase of treasury stock (727,795) (282,024) (307,282)
Cash dividends paid (478,933) (402,136) (333,229)
Proceeds from issuance of common stock, net 34,869 48,029 62,770
Tax benefits of stock-based compensation 64,437 48,140 47,213
Other, net ––(201)
Cash used by financing activities (1,107,421) (983,831) (802,515)
Effect of Foreign Currency Rate Changes
on Cash and Equivalents
(65,461) 7,005 4,039
Net Change in Cash and Equivalents 195,492 178,942 256,233
Cash and Equivalents — Beginning of Year 776,403 597,461 341,228
Cash and Equivalents — End of Period $ 971,895 $776,403 $ 597,461