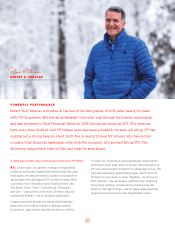
North Face 2014 Annual Report Download - page 30
Download and view the complete annual report
Please find page 30 of the 2014 North Face annual report below. You can navigate through the pages in the report by either clicking on the pages listed below, or by using the keyword search tool below to find specific information within the annual report.-
 1
1 -
2
-
3
-
4
-
5
-
6
-
7
-
8
-
9
-
10
-
11
-
12
-
13
-
14
-
15
-
16
-
17
-
18
-
19
-
 20
20 -
 21
21 -
 22
22 -
 23
23 -
 24
24 -
 25
25 -
 26
26 -
 27
27 -
 28
28 -
 29
29 -
 30
30 -
 31
31 -
 32
32 -
 33
33 -
 34
34 -
 35
35 -
 36
36
 |
 |
28
5-YEAR FINANCIAL SUMMARY
1 Operating results for 2014 include a noncash charge for impairment of goodwill and
intangible assets — $396.4 million (pretax) in operating income and $306.8 million
(after tax) in net income attributable to VF Corporation, $0.71 basic earnings per
share and $0.70 diluted earnings per share. Operating results for 2010 include a
noncash charge for impairment of goodwill and intangible assets — $201.7 million
(pretax) in operating income and $141.8 million (after tax) in net income attributable
to VF Corporation, $0.33 basic earnings per share and $0.32 diluted earnings
per share.
2 Dividend payment ratio is defined as dividends per share divided by earnings per
diluted share. Dividend payout ratios for 2014 and 2010, excluding the noncash charge
for impairment of goodwill and intangible assets, are 36.0% and 37.6%, respectively.
3 Total capital is defined as stockholders’ equity plus short-term and long-term debt.
4 Operating margin for 2014 and 2010, excluding the noncash charge for impairment
of goodwill and intangible assets, is 14.9% and 13.3%, respectively.
5 Return is defined as net income attributable to VF Corporation plus total interest
income/expense, net of taxes.
6 Invested capital is defined as average stockholders’ equity plus average short-term
and long-term debt. Return on invested capital for 2014 and 2010, excluding
the noncash charge for impairment of goodwill and intangible assets, is 18.6% and
15.6%, respectively.
7 Return on average stockholders’ equity for 2014 and 2010, excluding the
noncash charge for impairment of goodwill and intangible assets, is 24.5%
and 20.1%, respectively.
8 Return on average total assets for 2014 and 2010, excluding the noncash charge for
impairment of goodwill and intangible assets, is 13.6% and 11.8%, respectively.
9 The Timberland Company was purchased on September 13, 2011 and its results
have been included since the date of acquisition.
YEAR ENDED DECEMBER
In thousands, except per share amounts 2014
(9) 2013(9) 2012
(9) 2011(9) 2010
Summary of Operations1
Total revenues $ 12,282,161 $ 11,419,648 $ 10,879,855 $ 9,459,232 $ 7,702,589
Operating income 1,437,724 1,647,147 1,465,267 1,244,791 820,860
Net income attributable to VF Corporation 1,047,505 1,210,119 1,085,999 888,089 571,362
Earnings (loss) per common share attributable to
VF Corporation common stockholders — basic
$ 2.42 $ 2.76 $ 2.47 $ 2.03 $ 1.31
Earnings (loss) per common share attributable to
VF Corporation common stockholders — diluted
2.38 2.71 2.43 2.00 1.29
Dividends per share 1.1075 0.9150 0.7575 0.6525 0.6075
Dividend payout ratio246.5% 33.8% 31.2% 32.7% 46.9%
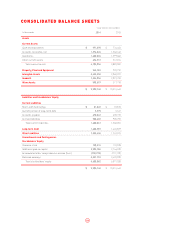
Financial Position
Working capital $ 2,565,613 $ 2,314,981 $ 1,717,371 $ 1,521,912 $ 1,716,585
Current ratio 2.6 2.5 2.0 1.9 2.5
Total assets $ 9,980,140 $ 10,315,443 $ 9,633,021 $ 9,313,126 $ 6,457,556
Long-term debt 1,423,581 1,426,829 1,429,166 1,831,781 935,882
Stockholders’ equity 5,630,882 6,077,038 5,125,625 4,525,175 3,861,319
Debt to total capital ratio3 20.5% 19.3% 26.5% 31.9% 20.2%
Weighted average common shares outstanding 432,611 438,657 439,292 437,148 435,056
Book value per common share $ 13.01 $ 13.80 $ 11.63 $ 10.23 $ 8.94
Other Statistics
Operating margin411.7% 14.4% 13.5% 13.2% 10.7%
Return on invested capital5,6 14.6% 17.6% 16.2% 15.8% 12.8%
Return on average stockholders’ equity5,7 19.2% 23.7% 24.7% 22.0% 16.5%
Return on average total assets5,8 10.7% 12.8% 11.9% 11.9% 9.6%
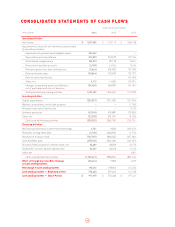
Cash provided by operations $ 1,697,629 $ 1,506,041 $ 1,275,000 $ 1,081,371 $ 1,001,282
Cash dividends paid 478,933 402,136 333,229 285,722 264,281
Basis of presentation: VF operates and reports using a 52/53-week fiscal year ending on the Saturday closest to December 31 of each year. For presentation purposes herein, all
references to “2014” relate to the 53-week fiscal period ended January 3, 2015, and all references to “2013,” “2012,” "2011" and "2010" relate to the 52-week fiscal periods ended
December 28, 2013, December 29, 2012, December 31, 2011, and January 1, 2011, respectively.