North Face 2008 Annual Report Download - page 36
Download and view the complete annual report
Please find page 36 of the 2008 North Face annual report below. You can navigate through the pages in the report by either clicking on the pages listed below, or by using the keyword search tool below to find specific information within the annual report.-
 1
1 -
2
-
3
-
4
-
5
-
6
-
7
-
8
-
9
-
10
-
11
-
12
-
13
-
14
-
15
-
16
-
17
-
18
-
19
-
20
-
21
-
22
-
23
-
24
-
25
-
 26
26 -
 27
27 -
 28
28 -
 29
29 -
 30
30 -
 31
31 -
 32
32 -
 33
33 -
 34
34 -
 35
35 -
 36
36 -
 37
37
 |
 |

52
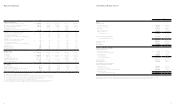
Consolidated Statements of Income
Year Ended December
In thousands, except per share amounts 2008 2007 2006
Net Sales $ 7,561,621 $ 7,140,811 $ 6,138,087
Royalty Income 80,979 78,548 77,707
Total Revenues 7,642,600 7,219,359 6,215,794
Costs and Operating Expenses
Cost of goods sold 4,283,680 4,080,022 3,515,624
Marketing, administrative and general expenses 2,419,925 2,173,896 1,874,026
6,703,605 6,253,918 5,389,650
Operating Income 938,995 965,441 826,144
Other Income (Expense)
Interest income 6,115 9,310 5,994
Interest expense (94,050) (72,122) (57,259)
Miscellaneous, net (3,103) 2,941 2,359
(91,038) (59,871) (48,906)
Income from Continuing Operations
Before Income Taxes 847,957 905,570 777,238
Income Taxes 245,209 292,324 242,187
Income from Continuing Operations 602,748 613,246 535,051
Discontinued Operations —
(21,625) (1,535)
Net Income 602,748 591,621 533,516
Earnings Per Common Share—Basic
Income from continuing operations $ 5.52 $ 5.55 $ 4.83
Discontinued operations — (0.20) (0.01)
Net income 5.52 5.36 4.82
Earnings Per Common Share—Diluted
Income from continuing operations $ 5.42 $ 5.41 $ 4.73
Discontinued operations — (0.19) (0.01)
Net income 5.42 5.22 4.72
Cash Dividends Per Common Share $ 2.33 $ 2.23 $ 1.94
Audited financial statements and notes, along with management’s discussion and analysis of results of operations and financial condition, are available
in our 2008 Annual Report on Form 10-K filed with the Securities and Exchange Commission, accessible on our website, www.vfc.com.
53
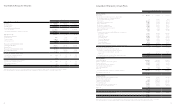
Consolidated Statements of Cash Flows
Audited financial statements and notes, along with management’s discussion and analysis of results of operations and financial condition, are available
in our 2008 Annual Report on Form 10-K filed with the Securities and Exchange Commission, accessible on our website, www.vfc.com.
Year Ended December
In thousands 2008 2007 2006
Operating Activities
Net income $ 602,748 $ 591,621 $ 533,516
Adjustments to reconcile net income to cash provided
by operating activities of continuing operations:
Loss from discontinued operations — 21,625 1,535
Depreciation 105,059 94,540 90,374
Amortization of intangible assets 39,427 27,106 18,003
Other amortization 21,685 19,581 20,469
Stock-based compensation 31,592 62,413 46,427
Provision for doubtful accounts 22,062 13,859 6,693
Pension funding in excess of expense (4,787) 7,094 (31,277)
Deferred income taxes 23,654 (3,748) (24,463)
Other, net (6,319) 3,763 (6,509)
Changes in operating assets and liabilities, net of acquisitions:
Accounts receivable 52,679 (49,673) (113,363)
Inventories (38,275) (24,113) (33,193)
Other current assets (66,866) 15,644 6,322
Accounts payable (67,214) 77,212 (19,043)
Accrued compensation (35,285) (1,932) (23,592)
Accrued income taxes 24,118 (7,541) (51,111)
Accrued liabilities 13,318 31,986 22,485
Other assets and liabilities (38,124) (45,808) 10,855
Cash provided by operating activities of continuing operations 679,472 833,629 454,128
Loss from discontinued operations — (21,625) (1,535)
Adjustments to reconcile loss from discontinued
operations to cash used by discontinued operations:
Loss on disposal of discontinued operations — 24,554 36,845
Other, net (1,071) (15,982) 1,315
Cash used by operating activities of discontinued operations (1,071) (13,053) 36,625
Cash provided by operating activities 678,401 820,576 490,753
Investing Activities
Capital expenditures (124,207) (113,863) (127,195)
Business acquisitions, net of cash acquired (93,377) (1,060,636) (39,301)
Software purchases (10,601) (6,367) (8,939)
Sale of property, plant and equipment 11,462 14,085 3,327
Sale of intimate apparel business — 348,714 —
Sale of other businesses 537 12,368 4,667
Other, net 400 (120) (323)
Cash used by investing activities of continuing operations (215,786) (805,819) (167,76 4)
Discontinued operations, net — (243) 1,017
Cash used by investing activities (215,786) (806,062) (166,747)
Financing Activities
Increase (decrease) in short-term borrowings (67,736) 36,785 (60,533)
Proceeds from long-term debt — 592,758 —
Payments on long-term debt (3,632) (168,671) (33,520)
Purchase of Common Stock (149,729) (350,000) (118,582)
Cash dividends paid (255,235) (246,634) (216,529)
Proceeds from issuance of Common Stock 64,972 69,539 119,675
Tax benefits of stock option exercises 22,504 15,571 24,064
Other, net (905) — —
Cash used by financing activities (389,761) (50,652) (285,425)
Effect of Foreign Currency Rate Changes on Cash (12,873) 14,777 8,086
Net Change in Cash and Equivalents 59,981 (21,361) 46,667
Cash and Equivalents—Beginning of Year 321,863 343,224 296,557
Cash and Equivalents—End of Year $ 381,844 $ 321,863 $ 343,224