National Oilwell Varco 2015 Annual Report Download - page 4
Download and view the complete annual report
Please find page 4 of the 2015 National Oilwell Varco annual report below. You can navigate through the pages in the report by either clicking on the pages listed below, or by using the keyword search tool below to find specific information within the annual report.-
 1
1 -
 2
2 -
 3
3 -
 4
4 -
 5
5 -
 6
6 -
 7
7 -
 8
8 -
 9
9 -
 10
10 -
 11
11 -
 12
12 -
 13
13 -
 14
14 -
 15
15 -
16
-
17
-
18
-
19
-
20
-
21
-
22
-
23
-
24
-
25
-
26
-
27
-
28
-
29
-
30
-
31
-
32
-
33
-
34
-
35
-
36
-
37
-
38
-
39
-
40
-
41
-
42
-
43
-
44
-
45
-
46
-
47
-
48
-
49
-
50
-
51
-
52
-
53
-
54
-
55
-
56
-
57
-
58
-
59
-
60
-
61
-
62
-
63
-
64
-
65
-
66
-
67
-
68
-
69
-
70
-
71
-
72
-
73
-
74
-
75
-
76
-
77
-
78
-
79
-
80
-
81
-
82
-
83
-
84
-
85
-
86
-
87
-
88
-
89
-
90
-
91
-
92
-
93
-
94
-
95
-
96
-
97
-
98
-
99
-
100
-
101
-
102
-
103
-
104
-
105
-
106
-
107
-
108
-
109
-
110
-
111
-
112
-
113
-
114
-
115
-
116
-
117
-
118
-
119
-
120
-
121
-
122
-
123
 |
 |

Table of Contents
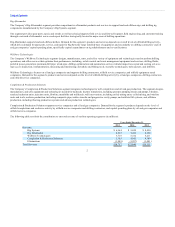
Sales from one segment to another generally are priced at estimated equivalent commercial selling prices; however, segments originating an external sale are
credited with the full profit to the Company. Eliminations include intercompany transactions conducted between the four reporting segments that are
eliminated in consolidation. Intercompany transactions within each reporting segment are eliminated within each reporting segment.
See Note 15 to our Consolidated Financial Statements included in this Annual Report on Form 10-K for financial information by segment and a geographical
breakout of revenues and long-lived assets. We have also included a glossary of oilfield terms at the end of Item 1. “Business” of this Annual Report.
The oil and gas industry has historically experienced significant volatility. Demand for the Company’s products and services depends primarily upon the
general level of activity in the oil and gas industry worldwide, including the number of drilling rigs in operation, the number of oil and gas wells being
drilled, the depth and drilling conditions of these wells, the volume of production, the number of well completions and the level of well remediation activity.
Oil and gas activity is in turn heavily influenced by, among other factors, oil and gas prices worldwide. High levels of drilling and well remediation generally
spurs demand for the Company’s products and services. Additionally, high levels of oil and gas activity increase cash flows available for oil and gas
companies, drilling contractors, oilfield service companies, and manufacturers of oil country tubular goods (“OCTG”) to invest in capital equipment that the
Company sells.
In 2010, as the financial crisis of the preceding three years eased and oil prices recovered, order rates began to improve across a broad array of rig equipment,
with a particular focus on continued build out of the deepwater fleet. Each year 2011, 2012 and 2013 saw a further improvement in order rates as commodity
prices remained at levels supporting sustained capital spending by our customers. Global rig count increased 5% in 2014 compared to 2013, after falling by
3% in 2013 compared to 2012. During the second half of 2014 and through 2015 the global oil and gas industry experienced a cyclical decline causing the
Company to experience a decline in new orders. Backlog for Rig Systems at December 31, 2015, 2014 and 2013, was $6.1 billion, $12.5 billion and $15.0
billion, respectively. Backlog for Completion & Production Solutions at December 31, 2015, 2014 and 2013 was $1.0 billion, $1.8 billion and $1.6 billion,
respectively.
The willingness of oil and gas operators to make capital investments to explore for and produce oil and natural gas will continue to be influenced by
numerous factors over which the Company has no control, including but not limited to: prices for oil and gas; supply and demand for oil and natural gas; the
ability or willingness of members of the Organization of Petroleum Exporting Countries (“OPEC”) to maintain oil price stability through voluntary
production limits; the level of oil production by non-OPEC countries; general economic and political conditions; costs of exploration and production; the
availability of new leases and concessions; access to external financing; and governmental regulations regarding, among other things, environmental
protection, climate change, taxation, price controls and product allocations. The willingness of drilling contractors and well servicing companies to make
capital expenditures for the type of specialized equipment the Company provides is also influenced by numerous factors over which the Company has no
control, including: the general level of oil and gas well drilling and servicing; rig day-rates; access to external financing; outlook for future increases in well
drilling and well remediation activity; steel prices and fabrication costs; and government regulations regarding, among other things, environmental
protection, climate change, taxation, and price controls.
See additional discussion on the current worldwide economic environment and related oil and gas activity levels in Item 1A. Risk Factors and Item 7.
Management’s Discussion and Analysis of Financial Condition and Results of Operations.
Oil and gas wells are usually drilled by drilling contractors using a drilling rig. A bit is attached to the end of a drill stem, which is assembled by the drilling
rig and its crew from 30 or 45-foot joints of drill pipe and specialized drilling components known as downhole tools. Using the conventional rotary drilling
method, the
3