National Oilwell Varco 2000 Annual Report Download - page 13
Download and view the complete annual report
Please find page 13 of the 2000 National Oilwell Varco annual report below. You can navigate through the pages in the report by either clicking on the pages listed below, or by using the keyword search tool below to find specific information within the annual report.
11
Products and Technology
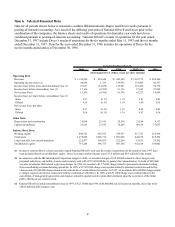
Revenues for the Products and Technology segment increased by $223.5 million (49 %) from 1999 primarily due to
increased sales of major capital equipment and drilling spares of $110 million, expendable pumps and pump parts
of $35 million and downhole tools of $52 million. Operating income in 2000 increased by $37.4 million from the
prior year due primarily to this substantial revenue increase. Revenues from acquisitions completed in 2000 under
the purchase method of accounting accounted for $56 million in incremental revenues and $0.5 million in operating
income over 1999.
Revenues for 1999 decreased by $447.1 million (49%) from 1998 primarily due to lower demand that resulted from
lower oil and gas prices. Sales of all types of capital equipment, rig packages and drilling spares were $370 million
below 1998 levels. Sales of pumps and expendable pump parts were $23 million lower than in the previous year
and downhole tools revenue declined $50 million. Primarily due to this revenue decline, operating income
decreased $136.4 million in 1999 compared to the prior year. Lower margins due to the reduced sales volume was
partially offset with lower operating costs resulting from cost reduction initiatives begun in late 1998.
Backlog of the Products and Technology capital products was $282 million at December 31, 2000, $114 million at
1999 and $83 million at December 31, 1998. Substantially all of the current backlog is expected to be shipped by
the end of 2001.
Distribution Services
Distribution Services revenues in 2000 increased $111.0 million from the 1999 level, reflecting the enhanced
drilling activity driven primarily by higher, more stable oil and gas prices. Revenues of maintenance, repair and
operating (“MRO”) supplies in the United States were 26% greater while Canadian revenues were 30% higher than
the prior year. Operating income of $12.9 million in 2000 reflects an $18.9 million improvement from 1999. The
margin increase resulting from the higher revenues, coupled with the absence of startup costs associated with the
installation of a new operating system, were the primary contributors to this significant improvement.
Distribution Services revenues in 1999 fell $198.2 million from the 1998 level due to the depressed market
conditions and the mid-year sale of the tubular product line which generated revenues in 1999 of approximately $24
million. The margin reduction resulting from the lower revenues was the primary contributor to the $6.0 million
operating loss recorded in 1999.
Corporate
Corporate charges represent the unallocated portion of centralized and executive management costs. A reduction of
$3.2 million in 2000 as compared to 1999 reflects the elimination of the IRI corporate operations as a result of the
merger. Costs associated with various e-strategy and e-commerce initiatives contributed in part to the $2.4 million
increase in 1999 over 1998. Corporate charges in 2001 are expected to approximate $8-10 million due to the
elimination of duplicative costs.
Special Charges
During 2000, the Company recorded a special charge, net of a $0.4 million credit from previous special charges, of
$14.1 million ($11.0 million after tax, or $0.14 per share) related to the merger with IRI International. Components
of the charge were (in millions):
Direct transaction costs $ 6.6
Severance 6.4
Facility closures 1.5
14.5
Prior year reversal (0.4)
$14.1


