Napa Auto Parts 2002 Annual Report Download - page 2
Download and view the complete annual report
Please find page 2 of the 2002 Napa Auto Parts annual report below. You can navigate through the pages in the report by either clicking on the pages listed below, or by using the keyword search tool below to find specific information within the annual report.-
 1
1 -
 2
2 -
 3
3 -
 4
4 -
 5
5 -
 6
6 -
 7
7 -
 8
8 -
 9
9 -
 10
10 -
 11
11 -
 12
12 -
 13
13 -
14
-
15
-
16
-
17
-
18
-
19
-
20
-
21
-
22
-
23
-
24
-
25
-
26
-
27
-
28
-
29
-
30
-
31
-
32
-
33
-
34
-
35
-
36
-
37
-
38
-
39
-
40
-
41
-
42
-
43
-
44
 |
 |

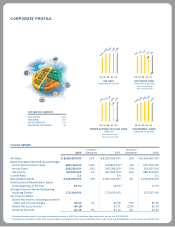
financial highlights
Increase/ Increase/
2002 (Decrease) 2001 (Decrease) 2000
Net Sales $8,258,927,000 0.5% $ 8,220,668,000 (2%) $ 8,369,857,000
Before Cumulative Effect and Unusual Charges:
Income Before Income Taxes 605,736,000 0.3% 603,813,000** (7%) 646,750,000
Income Taxes 238,236,000 (2%) 242,289,000** (7%) 261,427,000
Net Income 367,500,000 *2% 361,524,000** (6%) 385,323,000
Current Ratio 3.1 -3.4 - 3.1
Shareholders’ Equity 2,130,009,000 (9%) 2,345,123,000 4% 2,260,806,000
Rate Earned on Shareholders’ Equity
at the Beginning of the Year 15.7%*-16.0%** -17.7%
Average Common Shares Outstanding-
Assuming Dilution 175,104,000 -173,633,000 - 175,327,000
Per Common Share:
Diluted Net Income, excluding cumulative
effect and unusual charges $2.10 1% $2.08 (5%) $2.20
Diluted Net (Loss) Income ($0.16) -$1.71 (22%) $2.20
Dividends Declared $1.16 2% $1.14 4% $1.10
*Excluding cumulative effect of a change in accounting principle in 2002. After cumulative effect adjustment, net loss was $(27,590,000).
**Excluding unusual charges in 2001. After unusual charges, income before income taxes was $496,013,000, income taxes were $198,866,000, and net income was $297,147,000.
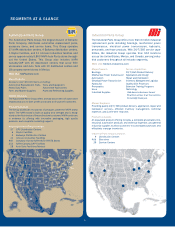
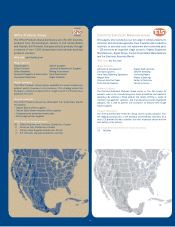
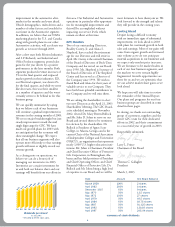
CORPORATE PROFILE
net sales
IN MILLIONS OF DOLLARS
98 99 00 01 02
net sales by segment
AUTOMOTIVE 52%
INDUSTRIAL 27%
OFFICE PRODUCTS 17%
ELECTRICAL/ELECTRONIC 4%
6,588 7,951
8,370
8,221
8,259
net income (loss)
IN MILLIONS OF DOLLARS
diluted earnings (loss) per share
IN DOLLARS
shareholders’ equity
IN MILLIONS OF DOLLARS
1.98
2.11
2.20
2.10
98 99 00 01 02
356
378
385
362
368
2,053
2,178
2,261
2,345
2,130
2.08
After unusual charges
After cumulative effect
98 99 00 01 02 98 99 00 01 02
297
(28)
1.71
(.16)
After unusual charges
After cumulative effect