Medtronic 2011 Annual Report Download - page 2
Download and view the complete annual report
Please find page 2 of the 2011 Medtronic annual report below. You can navigate through the pages in the report by either clicking on the pages listed below, or by using the keyword search tool below to find specific information within the annual report.-
 1
1 -
 2
2 -
 3
3 -
 4
4 -
 5
5 -
 6
6 -
 7
7 -
 8
8 -
 9
9 -
 10
10 -
 11
11 -
 12
12 -
 13
13 -
14
-
15
-
16
-
17
-
18
-
19
-
20
-
21
-
22
-
23
-
24
-
25
-
26
-
27
-
28
-
29
-
30
-
31
-
32
-
33
-
34
-
35
-
36
-
37
-
38
-
39
-
40
-
41
-
42
-
43
-
44
-
45
-
46
-
47
-
48
-
49
-
50
-
51
-
52
-
53
-
54
-
55
-
56
-
57
-
58
-
59
-
60
-
61
-
62
-
63
-
64
-
65
-
66
-
67
-
68
-
69
-
70
-
71
-
72
-
73
-
74
-
75
-
76
-
77
-
78
-
79
-
80
-
81
-
82
-
83
-
84
-
85
-
86
-
87
-
88
-
89
-
90
-
91
-
92
-
93
-
94
-
95
-
96
-
97
-
98
-
99
-
100
-
101
-
102
-
103
-
104
-
105
-
106
 |
 |

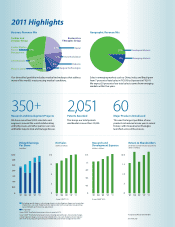
* Compound Annual Growth Rate
† 53-week year
Excluding special charges, restructuring charges, certain litigation charges, net, acquisition-
related items, non-cash charge to interest expense due to the accounting rules governing
convertible debt, and certain tax adjustments.
As reported
5-year CAGR* for diluted earnings per share, as reported 6.7%.
5-year CAGR* for diluted earnings per share, excluding special charges, restructuring charges,
certain litigation charges, net, acquisition-related items, non-cash charge to interest expense
due to the accounting rules governing convertible debt, and certain tax adjustments 8.8%.
’07 ’08 ’09 ’10†
0
.5
1.0
1.5
$2.0
’11
Return to Shareholders
(dividends issued and shares repurchased,
dollars in billions)
’07 ’08 ’09 ’10†
5-year CAGR* 6.3%
0
0.3
0.6
0.9
1.2
$1.5
’11
Research and
Development Expense
(dollars in billions)
’07 ’08 ’09 ‘10†
5-year CAGR* 7.1%
0
4
8
12
$16
’11
Net Sales
(dollars in billions)
‘07 ’08 ’09 ’10†
0
0.50
1.50
2.00
2.50
3.00
$3.50
’11
1.00
Diluted Earnings
Per Share
(in dollars)
91%
9%
31%
20%
3%
21%
10%
8%
7%
2011 Highlights
350+
Research and Development Projects
We have more than 9,000 scientists and
engineers around the world collaborating
with physicians and other partners on new
and better ways to treat and manage disease.
2,051
Patents Awarded
This brings our total patents
worldwide to more than 23,000.
60
Major Products Introduced
This was the largest portfolio of new
products introduced in one year in recent
history, with innovative technologies
launched across all businesses.
Sales in emerging markets such as China, India, and Brazil grew
from 7 percent of total sales in FY2010 to 9 percent in FY2011.
We expect 20percent of our total sales to come from emerging
markets within five years.
Geographic Revenue MixBusiness Revenue Mix
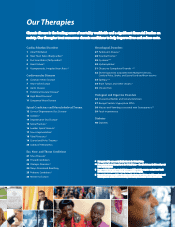
Our diversified portfolio includes medical technologies that address
many of the world’s most pressing medical conditions.
Cardiac and
Vascular Group
Physio-Control
CardioVascular
Cardiac Rhythm
Disease
Management
Restorative
Therapies Group
Surgical Technologies
Diabetes
Neuromodulation
Spinal
Emerging Markets
Developed Markets
72300cu_cvr 1 7/19/11 1:22 PM
72300cu_cvr 1 7/19/11 1:22 PM