Lockheed Martin 2008 Annual Report Download - page 2
Download and view the complete annual report
Please find page 2 of the 2008 Lockheed Martin annual report below. You can navigate through the pages in the report by either clicking on the pages listed below, or by using the keyword search tool below to find specific information within the annual report.-
 1
1 -
 2
2 -
 3
3 -
 4
4 -
 5
5 -
 6
6 -
 7
7 -
 8
8 -
 9
9 -
 10
10 -
 11
11 -
 12
12 -
 13
13 -
14
-
15
-
16
-
17
-
18
-
19
-
20
-
21
-
22
-
23
-
24
-
25
-
26
-
27
-
28
-
29
-
30
-
31
-
32
-
33
-
34
-
35
-
36
-
37
-
38
-
39
-
40
-
41
-
42
-
43
-
44
-
45
-
46
-
47
-
48
-
49
-
50
-
51
-
52
-
53
-
54
-
55
-
56
-
57
-
58
-
59
-
60
-
61
-
62
-
63
-
64
-
65
-
66
-
67
-
68
-
69
-
70
-
71
-
72
-
73
-
74
-
75
-
76
-
77
-
78
-
79
-
80
-
81
-
82
-
83
-
84
-
85
-
86
-
87
-
88
-
89
-
90
-
91
-
92
-
93
-
94
-
95
-
96
-
97
-
98
-
99
-
100
-
101
-
102
-
103
-
104
-
105
-
106
-
107
-
108
-
109
-
110
-
111
-
112
-
113
-
114
-
115
-
116
-
117
-
118
 |
 |

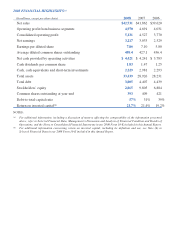
2008 FINANCIAL HIGHLIGHTS(a)
(In millions, except per share data) 2008 2007 2006
Net sales $42,731 $41,862 $39,620
Operating profit from business segments 4,970 4,691 4,031
Consolidated operating profit 5,131 4,527 3,770
Net earnings 3,217 3,033 2,529
Earnings per diluted share 7.86 7.10 5.80
Average diluted common shares outstanding 409.4 427.1 436.4
Net cash provided by operating activities $ 4,421 $ 4,241 $ 3,783
Cash dividends per common share 1.83 1.47 1.25
Cash, cash equivalents and short-term investments 2,229 2,981 2,293
Total assets 33,439 28,926 28,231
Total debt 3,805 4,407 4,439
Stockholders’ equity 2,865 9,805 6,884
Common shares outstanding at year-end 393 409 421
Debt-to-total-capital ratio 57% 31% 39%
Return on invested capital(b) 21.7% 21.4% 19.2%
NOTES:
(a) For additional information, including a discussion of matters affecting the comparability of the information presented
above, refer to Selected Financial Data, Management’s Discussion and Analysis of Financial Condition and Results of
Operations, and the Notes to Consolidated Financial Statements in our 2008 Form 10-K included in this Annual Report.
(b) For additional information concerning return on invested capital, including its definition and use, see Note (h) to
Selected Financial Data in our 2008 Form 10-K included in this Annual Report.