Kohl's 2009 Annual Report Download - page 30
Download and view the complete annual report
Please find page 30 of the 2009 Kohl's annual report below. You can navigate through the pages in the report by either clicking on the pages listed below, or by using the keyword search tool below to find specific information within the annual report.-
 1
1 -
2
-
3
-
4
-
5
-
6
-
7
-
8
-
9
-
10
-
11
-
12
-
13
-
14
-
15
-
16
-
17
-
18
-
19
-
 20
20 -
 21
21 -
 22
22 -
 23
23 -
 24
24 -
 25
25 -
 26
26 -
 27
27 -
 28
28 -
 29
29 -
 30
30 -
 31
31 -
 32
32 -
 33
33 -
 34
34 -
 35
35 -
 36
36 -
 37
37 -
 38
38 -
 39
39 -
 40
40 -
41
-
42
-
43
-
44
-
45
-
46
-
47
-
48
-
49
-
50
-
51
-
52
-
53
-
54
-
55
-
56
-
57
-
58
-
59
-
60
-
61
-
62
-
63
-
64
-
65
-
66
-
67
-
68
-
69
-
70
-
71
-
72
-
73
 |
 |

Table of Contents
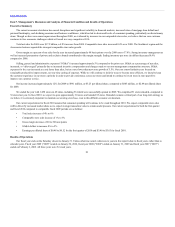
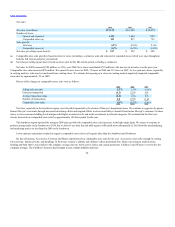
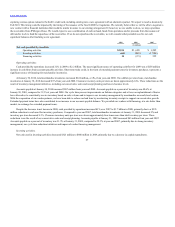
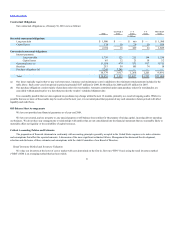
Debt Covenant Compliance. Our debt agreements contain various covenants including limitations on additional indebtedness and the following leverage
ratio:
Total Debt per Balance Sheet $2,068
Other Debt —
Subtotal 2,068
Rent x 8 3,987
A Included Indebtedness $6,055
Net Worth $7,853
Investments (accounted for under equity method) —
Subtotal 7,853
Included Indebtedness 6,055
B Capitalization $13,908
Leverage Ratio (A/B) 0.44
Maximum permitted Leverage Ratio 0.70
As of January 30, 2010, we were in compliance with all debt covenants and expect to remain in compliance during fiscal 2010.
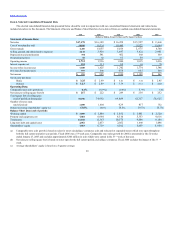
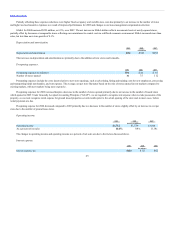
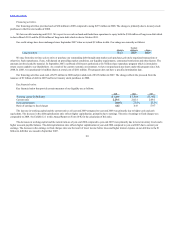
Free Cash Flow. We generated free cash flow of $1.6 billion in 2009, more than double our 2008 free cash flow of $684 million. Free cash flow is a
non-GAAP financial measure which we define as net cash provided by operating activities less capital expenditures. Free cash flow should be evaluated in
addition to, and not considered a substitute for, other financial measures such as net income and cash flow provided by operations. We believe that free cash
flow represents our ability to generate additional cash flow from our business operations.
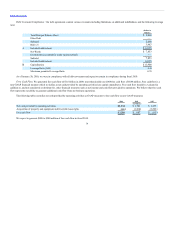
The following table reconciles net cash provided by operating activities (a GAAP measure) to free cash flow (a non-GAAP measure).
Net cash provided by operating activities $ 1,701 $1,235
Acquisition of property and equipment and favorable lease rights (1,014) (1,542)
Free cash flow $687 $(307)
We expect to generate $800 to $900 million of free cash flow in fiscal 2010.
30