Kohl's 2009 Annual Report Download - page 23
Download and view the complete annual report
Please find page 23 of the 2009 Kohl's annual report below. You can navigate through the pages in the report by either clicking on the pages listed below, or by using the keyword search tool below to find specific information within the annual report.-
 1
1 -
2
-
3
-
4
-
5
-
6
-
7
-
8
-
9
-
10
-
11
-
12
-
 13
13 -
 14
14 -
 15
15 -
 16
16 -
 17
17 -
 18
18 -
 19
19 -
 20
20 -
 21
21 -
 22
22 -
 23
23 -
 24
24 -
 25
25 -
 26
26 -
 27
27 -
 28
28 -
 29
29 -
 30
30 -
 31
31 -
 32
32 -
 33
33 -
34
-
35
-
36
-
37
-
38
-
39
-
40
-
41
-
42
-
43
-
44
-
45
-
46
-
47
-
48
-
49
-
50
-
51
-
52
-
53
-
54
-
55
-
56
-
57
-
58
-
59
-
60
-
61
-
62
-
63
-
64
-
65
-
66
-
67
-
68
-
69
-
70
-
71
-
72
-
73
 |
 |

Table of Contents
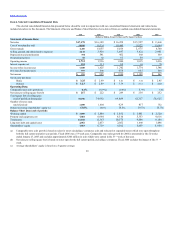
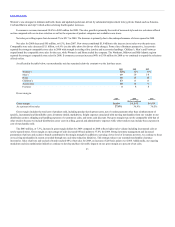
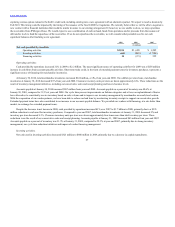
Women’s was strongest in intimate and both classic and updated sportswear, driven by substantial improvement in key private brands such as Sonoma,
Croft and Barrow and Apt 9 which achieved strong fourth quarter increases.
E-commerce revenues increased 38.0% to $492 million for 2009. The sales growth is primarily the result of increased style and size selections offered
on-line compared with our in-store selection as well as the expansion of product categories not available in our stores.
Net sales per selling square foot decreased 2% to $217 in 2009. The decrease is primarily due to the underperformance of stores opened in 2008.
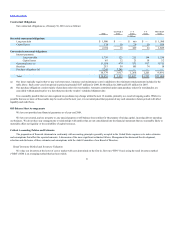
Net sales for 2008 decreased $85 million, or 0.5%, from 2007. New stores contributed $1.0 billion to the increase in net sales over the prior year.
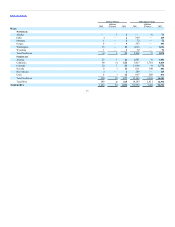
Comparable store sales decreased $1.1 billion, or 6.9% (see the table above for drivers of the change). From a line of business perspective, Accessories
reported the strongest comparable store sales in 2008 with strength in sterling silver jewelry and accessories/handbags. Children’s, Men’s and Footwear
outperformed the comparable store sales for the year, while Women’s and Home trailed the company. The Northeast, Midwest and Mid-Atlantic regions
reported the strongest comparable store sales for 2008. E-commerce revenues increased 48% to $356 million for 2008 as we continued to expand the selections
offered on-line.
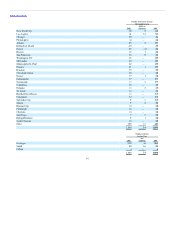
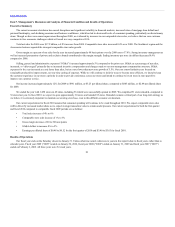
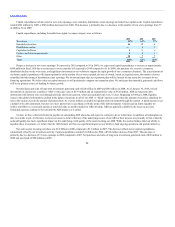
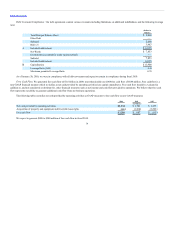
As reflected in the table below, our merchandise mix has remained relatively constant over the last three years:
Women’s 32% 33%
Men’s 19 19
Home 18 18
Children’s 13 13
Accessories 10 9
Footwear 8 8
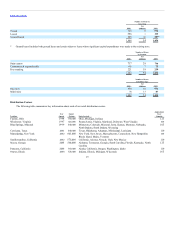
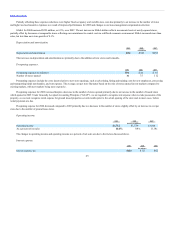
Gross margin.
Gross margin $6,055 $6,014
As a percent of net sales 36.9% 36.5%
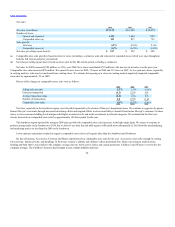
Gross margin includes the total cost of products sold, including product development costs, net of vendor payments other than reimbursement of
specific, incremental and identifiable costs; inventory shrink; markdowns; freight expenses associated with moving merchandise from our vendors to our
distribution centers; shipping and handling expenses of e-commerce sales; and terms cash discount. Our gross margin may not be comparable with that of
other retailers because we include distribution center costs in selling, general and administrative expenses while other retailers may include these expenses in
cost of merchandise sold.
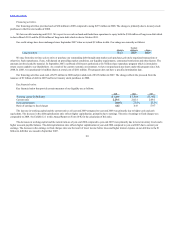
The $443 million, or 7.3%, increase in gross margin dollars for 2009 compared to 2008 reflects higher sales volume including incremental sales at
newly-opened stores. Gross margin as a percentage of sales increased 88 basis points to 37.8% for 2009. Strong inventory management and increased
penetration of private and exclusive brands contributed to the margin strength. In addition to carrying a lower level of inventory per store, we continue to focus
on receiving merchandise in season as needed through our cycle time reduction initiatives. This strategy reduces our seasonal merchandise clearance
inventories. Sales of private and exclusive brands reached 44% of net sales for 2009, an increase of 220 basis points over 2008. Additionally, our ongoing
markdown and size optimization initiatives continue to develop and have favorable impacts on our gross margin as a percent of net sales.
23