Kimberly-Clark 2007 Annual Report Download - page 2
Download and view the complete annual report
Please find page 2 of the 2007 Kimberly-Clark annual report below. You can navigate through the pages in the report by either clicking on the pages listed below, or by using the keyword search tool below to find specific information within the annual report.-
 1
1 -
 2
2 -
 3
3 -
 4
4 -
 5
5 -
 6
6 -
 7
7 -
 8
8 -
 9
9 -
 10
10 -
 11
11 -
 12
12 -
 13
13 -
14
-
15
-
16
-
17
-
18
-
19
-
20
-
21
-
22
-
23
-
24
-
25
-
26
-
27
-
28
-
29
-
30
-
31
-
32
-
33
-
34
-
35
-
36
-
37
-
38
-
39
-
40
-
41
-
42
-
43
-
44
-
45
-
46
-
47
-
48
-
49
-
50
-
51
-
52
-
53
-
54
-
55
-
56
-
57
-
58
-
59
-
60
-
61
-
62
-
63
-
64
-
65
-
66
-
67
-
68
-
69
-
70
-
71
-
72
-
73
-
74
-
75
-
76
-
77
-
78
-
79
-
80
-
81
-
82
-
83
-
84
-
85
-
86
-
87
-
88
-
89
-
90
-
91
-
92
-
93
-
94
-
95
-
96
-
97
-
98
-
99
-
100
-
101
-
102
-
103
-
104
-
105
-
106
-
107
-
108
-
109
-
110
-
111
-
112
-
113
-
114
-
115
-
116
-
117
-
118
-
119
-
120
-
121
-
122
-
123
 |
 |

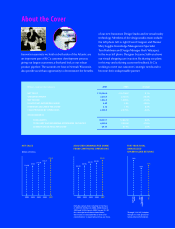
About the Cover
Millions, except per share amounts 2007 2006 change
NET SALES $ 18,266.0 $ 16,746.9 9.1%
OPERATING PROFIT 2,616.4 2,101.5 24.5%
NET INCOME 1,822.9 1,499.5 21.6%
DILUTED NET INCOME PER SHARE 4.09 3.25 25.8%
DIVIDENDS DECLARED PER SHARE 2.12 1.96 8.2%
CASH PROVIDED BY OPERATIONS 2,428.9 2,579.5 –5.8%
AT DECEMBER 31:
TOTAL ASSETS18,439.7 17,067.0 8.0%
TOTAL DEBT AND REDEEMABLE PREFERRED SECURITIES 6,496.4 4,395.8 47.8%
COMMON STOCK PRICE PER SHARE 69.34 67.95 2.0%
of our new Innovation Design Studio and its virtual reality
technology. Members of the design studio team include
(far left photo, left to right) Event Designer and Planner
Mary Logghe, Knowledge Management Specialist
Tom Poehlman and Design Manager Herb Velazquez.
In the near left photo, Designer Suzanne Sullivan shows
our virtual shopping cart in action. By sharing our plans
in this way and soliciting customer feedback, K-C is
working to meet our customers’ strategic needs and to
become their indispensable partner.
$15.9
$18.3
$15.1
NET SALES
2003 2004 2005 2006 2007
Billions of Dollars
$3.78
$4.25
$3.55
$3.28
ADJUSTED EARNINGS PER SHARE
FROM CONTINUING OPERATIONS
2003 2004 2005 2006 2007
Excludes certain items totaling $0.16/share
in 2007, $0.65/share in 2006, $0.50/share in
2005 and $0.05/share in 2003. See pp.98–101
for a description of the excluded items,
the reasons we excluded these items and
reconciliations to reported earnings per share.
11%
10%
13%
FIVE-YEAR TOTAL
ANNUALIZED
SHAREHOLDER RETURNS
S&P 500
Index
Through 12/31/07, includes
changes in stock price and
reinvestment of dividends.
S&P
Consumer
Staples Index
K-C
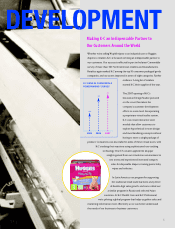
Innovation summits we hold on both sides of the Atlantic are
an important part of K-C’s customer development process,
giving our largest customers a firsthand look at our robust
product pipeline. The summits we host in Neenah, Wisconsin,
also provide us with an opportunity to demonstrate the benefits
$16.7 $3.90
$14.0