Kentucky Fried Chicken 2012 Annual Report Download - page 72
Download and view the complete annual report
Please find page 72 of the 2012 Kentucky Fried Chicken annual report below. You can navigate through the pages in the report by either clicking on the pages listed below, or by using the keyword search tool below to find specific information within the annual report.-
 1
1 -
2
-
3
-
4
-
5
-
6
-
7
-
8
-
9
-
10
-
11
-
12
-
13
-
14
-
15
-
16
-
17
-
18
-
19
-
20
-
21
-
22
-
23
-
24
-
25
-
26
-
27
-
28
-
29
-
30
-
31
-
32
-
33
-
34
-
35
-
36
-
37
-
38
-
39
-
40
-
41
-
42
-
43
-
44
-
45
-
46
-
47
-
48
-
49
-
50
-
51
-
52
-
53
-
54
-
55
-
56
-
57
-
58
-
59
-
60
-
61
-
 62
62 -
 63
63 -
 64
64 -
 65
65 -
 66
66 -
 67
67 -
 68
68 -
 69
69 -
 70
70 -
 71
71 -
 72
72 -
 73
73 -
 74
74 -
 75
75 -
 76
76 -
 77
77 -
 78
78 -
 79
79 -
 80
80 -
 81
81 -
 82
82 -
83
-
84
-
85
-
86
-
87
-
88
-
89
-
90
-
91
-
92
-
93
-
94
-
95
-
96
-
97
-
98
-
99
-
100
-
101
-
102
-
103
-
104
-
105
-
106
-
107
-
108
-
109
-
110
-
111
-
112
-
113
-
114
-
115
-
116
-
117
-
118
-
119
-
120
-
121
-
122
-
123
-
124
-
125
-
126
-
127
-
128
-
129
-
130
-
131
-
132
-
133
-
134
-
135
-
136
-
137
-
138
-
139
-
140
-
141
-
142
-
143
-
144
-
145
-
146
-
147
-
148
-
149
-
150
-
151
-
152
-
153
-
154
-
155
-
156
-
157
-
158
-
159
-
160
-
161
-
162
-
163
-
164
-
165
-
166
-
167
-
168
-
169
-
170
-
171
-
172
 |
 |

YUM! BRANDS, INC.-2013Proxy Statement54
Proxy Statement
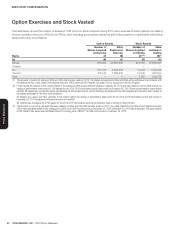
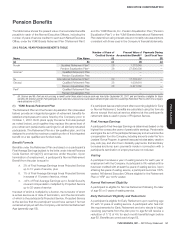
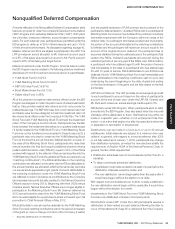
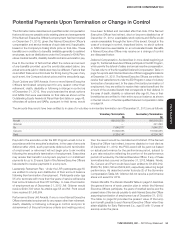
EXECUTIVE COMPENSATION
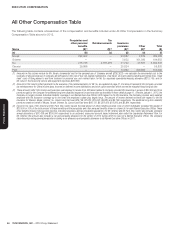
Name
Executive
Contributions
in Last FY
($)(1)
Registrant
Contributions
in Last FY
($)(2)
Aggregate
Earnings in
Last FY
($)(3 )
Aggregate
Withdrawals/
Distributions
($)(4 )
Aggregate
Balance at
Last FYE
($)(5 )
(a) (b) (c) (d) (e) (f)
Novak 7,520,126 — 19,411,049 214,219 169,819,580
Grismer 441,090 238,468 40,687 1,985 1,008,048
Su 4,352,906 — 403,086 1,940,443 7,646,877
Carucci 2,471,683 — 1,631,382 199,426 15,509,055
Pant — 300,000 832,361 6,692 7,882,711
(1) Amounts in column (b) reflect amounts that were also reported as compensation in our Summary Compensation Table filed last year or would have been reported as
compensation in our Summary Compensation Table last year if the executive were a Named Executive Officer.
(2) Amounts in column (c) reflect Company contributions for EID Program matching contribution and/or LRP allocation as follows: Mr. Grismer, $147,030 EID matching
contribution and $91,438 LRP allocation; and Mr. Pant, $300,000 LRP allocation.
(3) Amounts in column (d) reflect earnings during the last fiscal year on deferred amounts. All earnings are based on the investment alternatives offered under the EID
Program or the earnings credit provided under the LRP described in the narrative above this table. The EID Program earnings are market based returns and, therefore,
are not reported in the Summary Compensation Table. For Messrs. Grismer and Pant, of their earnings reflected in this column, $6,115 and $25,225 respectively
were deemed above market earnings accruing to each of their accounts under the LRP. For above market earnings on nonqualified deferred compensation, see the
“Change in Pension Value and Nonqualified Deferred Compensation Earnings” column of the Summary Compensation Table.
(4 ) All amounts shown in column (e) were distributed in accordance with the executive’s deferral election , except in the case of the following amounts distributed to pay
payroll taxes due upon their account balance under the EID Program or the LRP for 2012.
Novak 139,572
Grismer 1,985
Carucci 30,102
Pant 6,692
(5 ) Amounts reflected in column (f) are the year-end balances for each executive under the EID Program and the LRP. As required under SEC rules, below is the portion
of the year-end balance for each executive which has previously been reported as compensation to the executive in the Company’s Summary Compensation Table for
2012 and prior years or would have been reported as compensation if the executive had been a Named Executive Officer in those previous years.
Novak 51,240,041
Grismer 954,858
Su 6,981,892
Carucci 9,118,919
Pant 4,324,564
The difference between these amounts and the amount of the year-end balance for each executive represents the total aggregate
earnings accumulated under the program with respect to that compensation.