John Deere 2010 Annual Report Download - page 12
Download and view the complete annual report
Please find page 12 of the 2010 John Deere annual report below. You can navigate through the pages in the report by either clicking on the pages listed below, or by using the keyword search tool below to find specific information within the annual report.-
 1
1 -
 2
2 -
 3
3 -
 4
4 -
 5
5 -
 6
6 -
 7
7 -
 8
8 -
 9
9 -
 10
10 -
 11
11 -
 12
12 -
 13
13 -
 14
14 -
 15
15 -
 16
16 -
 17
17 -
 18
18 -
 19
19 -
 20
20 -
 21
21 -
 22
22 -
23
-
24
-
25
-
26
-
27
-
28
-
29
-
30
-
31
-
32
-
33
-
34
-
35
-
36
-
37
-
38
-
39
-
40
-
41
-
42
-
43
-
44
-
45
-
46
-
47
-
48
-
49
-
50
-
51
-
52
-
53
-
54
-
55
-
56
-
57
-
58
-
59
-
60
 |
 |

12
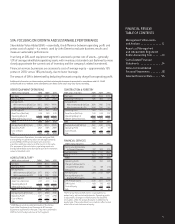
MANAGEMENT’S DISCUSSION AND ANALYSIS
RESULTS OF OPERATIONS FOR THE YEARS ENDED
OCTOBER 31, 2010, 2009 AND 2008
OVERVIEW
Organization
The company’s Equipment Operations generate revenues and
cash primarily from the sale of equipment to John Deere dealers
and distributors. The Equipment Operations manufacture and
distribute a full line of agricultural equipment; a variety of
commercial, consumer and landscapes equipment and products;
and a broad range of equipment for construction and forestry.
The company’s Financial Services primarily provide credit
services, which mainly fi nance sales and leases of equipment
by John Deere dealers and trade receivables purchased from
the Equipment Operations. In addition, Financial Services
offer crop risk mitigation products. The information in the
following discussion is presented in a format that includes
information grouped as consolidated, Equipment Operations
and Financial Services. The company also views its operations
as consisting of two geographic areas, the U.S. and Canada,
and outside the U.S. and Canada. The company’s reportable
operating segments consist of agriculture and turf, construction
and forestry, and credit.
Trends and Economic Conditions
Industry farm machinery sales in the U.S. and Canada for 2011
are forecast to be approximately the same as 2010. Industry sales
in Western Europe are forecast to increase 5 to 10 percent,
while South American industry sales are projected to be
approximately the same. Industry sales in Central Europe and
the Commonwealth of Independent States are expected to have
moderate gains. Industry sales of turf and utility equipment in the
U.S. and Canada are expected to be approximately the same.
The company’s agriculture and turf equipment sales increased
10 percent in 2010 and are forecast to increase by 7 to 9 percent
for 2011. Construction equipment markets are forecast to be
somewhat improved, while global forestry markets are expected
to move signifi cantly higher in 2011. The company’s construc-
tion and forestry sales increased 41 percent in 2010 and are
forecast to increase by 25 to 30 percent in 2011. Net income
for the company’s credit operations in 2011 is forecast to increase
to approximately $360 million.
Items of concern include the uncertainty of the global
economic recovery, the impact of sovereign and state debt,
capital market disruptions, the availability of credit for the
company’s customers and suppliers, the effectiveness of
governmental actions in respect to monetary policies, trade and
general economic conditions, and fi nancial regulatory reform.
Signifi cant fl uctuations in foreign currency exchange rates and
volatility in the price of many commodities could also impact
the company’s results. The availability of certain components
that could impact the company’s ability to meet production
schedules continues to be monitored. Designing and producing
products with engines that continue to meet high performance
standards and increasingly stringent engine emissions regulations
is one of the company’s major priorities.
The company’s strong performance for the year refl ects
a disciplined approach to executing the company’s business
plans and was achieved despite continuing weakness in certain
regions and business sectors. Although conditions continued
to be positive in the U.S. farm sector, European agricultural
markets remained soft. The company’s construction equipment
sales benefi ted from somewhat stronger overall demand,
but remained far below normal levels. With the company’s
performance in 2010, it remains well positioned to capitalize
on positive global economic trends.
2010 COMPARED WITH 2009
CONSOLIDATED RESULTS
Worldwide net income attributable to Deere & Company in
2010 was $1,865 million, or $4.35 per share diluted ($4.40
basic), compared with $873 million, or $2.06 per share diluted
($2.07 basic), in 2009. Included in net income for 2009 were
charges of $381 million pretax ($332 million after-tax), or $.78
per share diluted and basic, related to impairment of goodwill
and voluntary employee separation expenses (see Note 5).
Net sales and revenues increased 13 percent to $26,005 million
in 2010, compared with $23,112 million in 2009. Net sales of
the Equipment Operations increased 14 percent in 2010 to
$23,573 million from $20,756 million last year. The sales
increase was primarily due to higher shipment volumes.
The increase also included a favorable effect for foreign currency
translation of 3 percent and a price increase of 2 percent.
Net sales in the U.S. and Canada increased 14 percent in 2010.
Net sales outside the U.S. and Canada increased by 14 percent
in 2010, which included a favorable effect of 5 percent for
foreign currency translation.
Worldwide Equipment Operations had an operating
profi t of $2,909 million in 2010, compared with $1,365 million
in 2009. The higher operating profi t was primarily due to
higher shipment and production volumes, improved price
realization, the favorable effects of foreign currency exchange
and lower raw material costs, partially offset by increased
postretirement costs and higher incentive compensation expenses.
Last year was also affected by a goodwill impairment charge and
voluntary employee separation expenses.
The Equipment Operations’ net income, including
noncontrolling interests, was $1,492 million in 2010, compared
with $677 million in 2009. The same operating factors
mentioned above affected these results.
Net income of the company’s Financial Services operations
attributable to Deere & Company in 2010 increased to
$373 million, compared with $203 million in 2009. The increase
was primarily a result of improved fi nancing spreads and a lower
provision for credit losses. Additional information is presented in
the following discussion of the “Worldwide Credit Operations.”
The cost of sales to net sales ratio for 2010 was 73.8 percent,
compared with 78.3 percent last year. The decrease was
primarily due to higher shipment and production volumes,
improved price realization, favorable effects of foreign currency
exchange and lower raw material costs. A larger goodwill
impairment charge and voluntary employee separation expenses
affected last year’s ratio.