John Deere 2010 Annual Report Download - page 10
Download and view the complete annual report
Please find page 10 of the 2010 John Deere annual report below. You can navigate through the pages in the report by either clicking on the pages listed below, or by using the keyword search tool below to find specific information within the annual report.-
 1
1 -
 2
2 -
 3
3 -
 4
4 -
 5
5 -
 6
6 -
 7
7 -
 8
8 -
 9
9 -
 10
10 -
 11
11 -
 12
12 -
 13
13 -
 14
14 -
 15
15 -
 16
16 -
 17
17 -
 18
18 -
 19
19 -
 20
20 -
 21
21 -
22
-
23
-
24
-
25
-
26
-
27
-
28
-
29
-
30
-
31
-
32
-
33
-
34
-
35
-
36
-
37
-
38
-
39
-
40
-
41
-
42
-
43
-
44
-
45
-
46
-
47
-
48
-
49
-
50
-
51
-
52
-
53
-
54
-
55
-
56
-
57
-
58
-
59
-
60
 |
 |

10
10
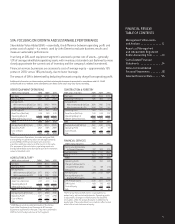
FINANCIAL SERVICES – SVA (MM)
2008 2009 2010
$59 $64
-$14 8
Helped by improved fi nancing –
spreads and a lower provision
for losses, net income attri-
butable to Deere & Company
reaches $372.5 million; return
on equity climbs to 12.2%.
Refl ecting division’s vital role in –
supporting sale of John Deere
equipment, average portfolio
of loans and leases increases by 5%, to $23.5 billion.
Credit quality remains high: losses on average portfolio decline –
to 0.48%.
Increasing focus on risk protection for ag producers, insurance –
company is launched to oversee crop-insurance business.
John Deere Financial becomes new name for operation –
formerly known as John Deere Credit; new name (offi cially
adopted in October 2010) better represents full breadth of
products and services being offered.
Sale of wind-energy business completed; move illustrates a –
sharpened focus on core operations.
AGRICULTURE & TURF – SVA (MM)
Aided by healthy farm sector –
and large-equipment sales
in U.S. and Brazil, operating
profi t nearly doubles, to
$2.790 billion.
SVA shows more than –
four-fold increase on modest
10% sales gain, bolstered
by dramatic improvement
in profi t.
John Deere Technology –
Center-India, at Pune,
named global engineering lead for development of small tractors
for all markets.
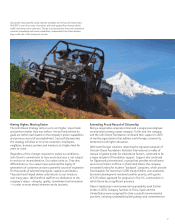
Results helped by higher sales of premium lawn tractors, utility –
vehicles and commercial mowing equipment.
Company’s largest-ever product introduction in Latin America –
features 50 products, including 2-row sugarcane harvester.
Investment of approximately $100 million announced to modernize –
Waterloo, Iowa, foundry; project will enhance manufacturing
fl exibility and responsiveness.
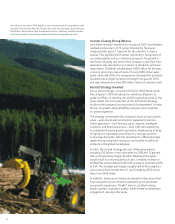
Sales climb 41% as demand –
picks up for company’s
innovative construction
and forestry products;
operating profi t stages
strong turnaround, rising
to $119 million.
Higher profi t and rigorous –
asset management result in
improved SVA performance.
Demonstrating division’s increasing focus on serving global –
markets, C&F opens joint-venture factory in Tamil Nadu,
India; facility will produce backhoes and wheel loaders for
Asian markets.
Division announces plans for its fi rst wholly-owned –
construction-equipment production facility outside U.S.
Factory near Tianjin, China, will build wheel loaders and
excavators primarily for developing markets.
Deere becomes fi rst company to begin shipping construction –
machines with above-175-hp engines (744K loader) certifi ed
to meet rigorous U.S. Interim Tier 4 emissions standards.
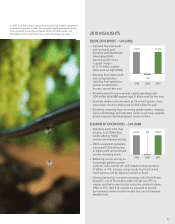
The graph compares the cumulative total returns of Deere & Company, the S&P 500 Construction &
Farm Machinery Index, and the S&P 500 Stock Index over a fi ve-year period. It assumes $100
was invested on October 31, 2005, and that dividends were reinvested. Deere & Company stock
price at October 31, 2010, was $76.80. The Standard & Poor’s 500 Construction & Farm Machinery
Index is made up of Deere (DE), Caterpillar (CAT), Paccar (PCAR), and Cummins (CMI). The stock
performance shown in the graph is not intended to forecast and does not necessarily indicate
future price performance.
Copyright © 2010 Standard & Poor’s, a division of The McGraw-Hill Companies, Inc.
All rights reserved.
At October 31 2005 2006 2007 2008 2009 2010
Deere & Company $100.00 $143.15 $264.60 $133.71 $162.52 $279.26
S&P Con & Farm Mach $100.00 $127.09 $186.91 $90.16 $124.72 $197.55
S&P 500 $100.00 $116.34 $133.28 $85.17 $93.52 $108.97
Deere compared to S&P 500 Index
and S&P 500 Construction & Farm Machinery Index
$300
$250
$200
$150
$100
$50
$0
2005 2006 2007 2008 2009 2010
Deere & Company S&P 500 Construction & Farm Machinery S&P 500
5-YEAR CUMULATIVE TOTAL RETURN CONSTRUCTION & FORESTRY – SVA (MM)
2008 2009 2010
$1,49 4 * $ 4 41 $1, 813
* 2008 restated to refl ect 2009 combination
of former Agricultural and Commercial &
Consumer Equipment segments.
2008 2009 2010
$149
-$16 3
-$377