Isuzu 2005 Annual Report Download - page 16
Download and view the complete annual report
Please find page 16 of the 2005 Isuzu annual report below. You can navigate through the pages in the report by either clicking on the pages listed below, or by using the keyword search tool below to find specific information within the annual report.-
 1
1 -
2
-
3
-
4
-
5
-
 6
6 -
 7
7 -
 8
8 -
 9
9 -
 10
10 -
 11
11 -
 12
12 -
 13
13 -
 14
14 -
 15
15 -
 16
16 -
 17
17 -
 18
18 -
 19
19 -
 20
20 -
 21
21 -
 22
22 -
 23
23 -
 24
24 -
 25
25 -
 26
26 -
27
-
28
-
29
-
30
-
31
-
32
-
33
-
34
-
35
-
36
-
37
-
38
 |
 |

17
«
Isuzu Motors Limited Annual Report 2005
Results of Operations
Significant accounting policies
The consolidated financial statements of the Isuzu group are prepared in
accordance with the generally accepted accounting principles of Japan. In the
preparation of these statements, the amounts recorded for items including bad
debt allowance, inventory, investments, income taxes, retirement benefits, and
provisions for product warranties are estimates that reflect the judgment of
management. Because of the uncertain nature of estimates, in some cases ac-
tual results may vary from initial estimates, and this may have a negative impact
on earnings results.
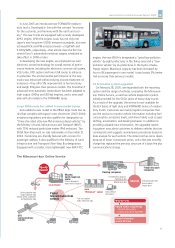
Sales
In fiscal 2005 (ended March 31, 2005) Isuzu’s consolidated-basis sales rose
4.4% from the previous year to ¥1,493,567 million, as worldwide vehicle unit
sales increased 20.9% to 339,162 units.
Although the Japanese economy made a gradual recovery on improved capi-
tal expenditure and corporate earnings trends, the outlook was clouded in the
second half by rising raw material prices and the impact of yen appreciation.
In the commercial vehicle market, overall demand for standard trucks declined
15.0% from the previous fiscal year to 99,584 units and demand for 2–3 ton
trucks fell a sharp 22.4% to 114,176 units as demand associated with the intro-
duction of new emissions regulations ran its course. In this environment, Isuzu
gained market share through aggressive sales initiatives to capture 27.4% share
of the standard truck market (up 2.5 percentage points from the previous year)
and 38.4% share of the 2–3 ton truck market, an increase of 2.3 percentage
points from the previous year. As a result, domestic sales declined a marginal
0.3% to ¥625,749 million.
Sales in Asia grew 11.3% from the previous fiscal year to ¥374,172 mil-
lion from the impact of consolidating Thai manufacturing operations including
Isuzu Motors Co., (Thailand) Ltd. and brisk sales in China and the ASEAN region
where Isuzu pioneered its business ahead of competitors. In the Thai market,
where pickup trucks account for around 60% of the total, Isuzu pickup trucks
held 38% market share, sustaining steady sales growth despite intensifying
competition.
North American sales fell 15.0% to ¥213,901 million as we withdrew from
local SUV production and shifted emphasis to profit.
Sales in other regions grew a sharp 30.0% to ¥279,744 million, mainly be-
cause of increasing exports of pickup trucks produced in Thailand to other
regions.
Operating income
Operating income for fiscal 2005 was a record ¥87,214 million, up 3.2% from
a year earlier. Rationalization, including raw material expense reduction, contribut-
ed ¥12,600 million, consolidation of manufacturing operations in Thailand added
¥5,000 million, and lower depreciation and other expense cuts had a ¥4,000 mil-
lion positive impact on operating income, offset against ¥12,700 million negative
impact from increased expenses, ¥3,800 million from a worsening sales mix, and
¥2,400 million due to foreign exchange fluctuations.
Looking at each of our key business areas, operating income at the parent
company declined ¥6,400 million from the previous year to ¥60,500 million, be-
cause rationalization such as raw material cost savings and expense cuts could
not fully compensate for a fall in gross profit on lower domestic vehicle sales
and increases in raw materials prices, and selling and R&D expenses.
Consolidated sales subsidiaries in Japan posted an operating income of
¥6,000 million, down ¥1,500 million from the previous year. Lower domestic
demand weighed on profits despite efforts to improve efficiency such as review-
ing sales bases.
In North America, the operating loss shrank ¥1,000 million to ¥400 million
as a result of progress with structural reform, including withdrawal from local
SUV production.
In ASEAN, operating income grew ¥8,000 million to ¥15,200 million due
largely to the consolidation of Thai manufacturing operations and sustained
brisk pickup truck sales in Thailand.
(The figures shown for each of our key business areas above reflect the sim-
ple addition of the profits and losses of the parent company and consolidated
subsidiaries, grouped according to the characteristics of each unit.)
As a result, our operating margin contracted 0.1 percentage point from
5.9% in fiscal 2004 to 5.8% in fiscal 2005.
Note: operating income yen amounts are then rounded down in thousands
Non-operating gains/losses
In fiscal 2005 we posted a non-operating profit of ¥4,340 million, an im-
provement of ¥7,152 million from the previous year.
Equity-method profit increased ¥5,449 million to ¥15,811 million because of
continuing strong performance of engine manufacturing operations in North
America and Poland (both equity-method companies) and group companies in
Japan.
Progress with reduction of interest-bearing debt resulted in a ¥700 million
improvement in net interest (interest received minus interest paid) to ¥10,500
million. We posted a foreign exchange gain of ¥500 million in fiscal 2005, an
improvement of ¥2,700 million from fiscal 2004.
Extraordinary gains/losses
In fiscal 2004, we posted an extraordinary loss of ¥26,321 million, mainly
associated with the overhaul of our domestic sales network such as disposal
of fixed assets in the process of adjustments to our real estate holdings, and
the restructuring of our North American business. In fiscal 2005, the extraordi-
nary loss improved ¥3,532 million to ¥22,788 million. Main extraordinary loss
items were associated with consolidation and reorganization of the domestic
sales network and disposal of fixed assets accompanying the relocation of the
Kawasaki plant.
Taxes
In fiscal 2004, Isuzu’s net tax expense, including corporate income taxes, mu-
nicipal taxes, and business taxes and after adjustments was a ¥77 million gain,
but in fiscal 2005 it was a net expense of ¥6,245 million because of increased
corporate tax payments at the parent and ASEAN subsidiaries.
Minority Interests
Minority interests consist primarily of profits returned to the minority share-
holders of our locally incorporated subsidiaries in ASEAN and North America.
The figure increased from ¥720 million on fiscal 2004 to ¥2,484 million in fiscal
2005.
Management’s Discussion and Analysis of Financial Condition and Results of Operation
700
600
500
400
300
200
100
0North America Asia Others
Geographical Segment Information — Sales
FY2003
FY2004
FY2005
378
252
214 211
336
374
Ja
p
an
215
280
287
474
627 626
(Billions of yen)
11 65
80
60
40
20
0
-20
-40
486
-24
-1 -0
3710
-2
1
Parent Japanese
DLRs
North America ASEAN Others Eliminations
Business Areas Segment Information — Operating Income
(Billions of yen)
FY2003
FY2004
FY2005
67 61
1313 15