Invacare 2005 Annual Report Download - page 2
Download and view the complete annual report
Please find page 2 of the 2005 Invacare annual report below. You can navigate through the pages in the report by either clicking on the pages listed below, or by using the keyword search tool below to find specific information within the annual report.-
 1
1 -
 2
2 -
 3
3 -
 4
4 -
 5
5 -
 6
6 -
 7
7 -
 8
8 -
 9
9 -
 10
10 -
 11
11
 |
 |

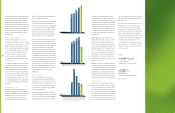
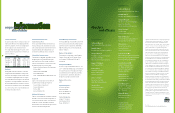
*Includingchargerelatedtorestructuringactivitiesof$7,533($5,160or$0.15perdilutedshareaftertax)recordedin2005.
**Freecashflowisanon-GAAPfinancialmeasurethatiscomprisedofnetcashprovidedbyoperatingactivitiesless
purchasesofpropertyandequipment.Managementbelievesthatthisfinancialmeasureprovidesmeaningfulinformation
forevaluatingtheoverallfinancialperformanceoftheCompanyanditsabilitytorepaydebtormakefutureinvestments
(includingacquisitions).PleaseseeItem7:Management‘sDiscussionandAnalysisofFinancialConditionandResultsof
OperationsinInvacare’sForm10-Kforareconciliationtable.
InvacareCorporationisthe
globalleaderinthemanufacture
anddistributionofinnovativehomeand
long-termcaremedicalproductsthat
promoterecoveryandactivelifestyles.
TheCompanyhas6,100associatesand
marketsitsproductsinover80countries
aroundtheworld.Invacarestockis
tradedontheNewYorkStockExchange
underthesymbol“IVC.”
OnecharacteristicmarksInvacare’s
remarkableriseoverthelastquarter
ofacentury:theabilitytorespond
effectivelytochangingmarket
conditions.Lastyear,Invacarelaunched
anaggressiveglobalrestructuringto
positiontheCompanytocontinuously
competeinthecurrentindustry
environment.Withitsfinancialstrength,
innovativeproducts,globalsupplychain,
anditsdetermination,nooneinthehome
medicalequipmentindustryisbetter
positionedtosucceedthanInvacare.
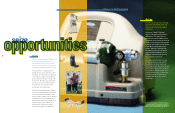
seizeopportunities|2
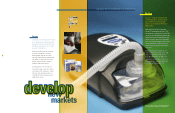
developnewmarkets|4
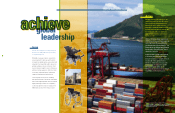
achievegloballeadership|6
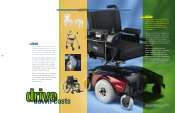
drivedowncosts|8
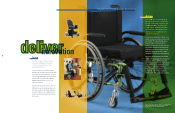
deliverinnovation|10
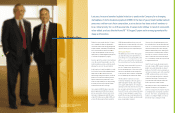
lettertoshareholders|12
TwelveMonthsEndedDecember31,
(Dollarsinthousands,exceptpersharedata) 2005 2004
NetSales $1,529,732 $1,403,327
NetEarnings 48,852 75,197
NetEarningsperShare–AssumingDilution 1.51* 2.33
DividendsperCommonShare 0.05 0.05
TotalAssets 1,622,953 1,628,124
WorkingCapital 237,759 307,010
TotalDebt 537,981 550,036
Shareholders’Equity 752,688 753,438
FreeCashFlow**50,795 56,924
TotalDebttoCapitalization 41.7% 42.2%
financial