Intel 1996 Annual Report Download - page 55
Download and view the complete annual report
Please find page 55 of the 1996 Intel annual report below. You can navigate through the pages in the report by either clicking on the pages listed below, or by using the keyword search tool below to find specific information within the annual report.-
 1
1 -
2
-
3
-
4
-
5
-
6
-
7
-
8
-
9
-
10
-
11
-
12
-
13
-
14
-
15
-
16
-
17
-
18
-
19
-
20
-
21
-
22
-
23
-
24
-
25
-
26
-
27
-
28
-
29
-
30
-
31
-
32
-
33
-
34
-
35
-
36
-
37
-
38
-
39
-
40
-
41
-
42
-
43
-
44
-
 45
45 -
 46
46 -
 47
47 -
 48
48 -
 49
49 -
 50
50 -
 51
51 -
 52
52 -
 53
53 -
 54
54 -
 55
55 -
 56
56 -
 57
57 -
 58
58 -
 59
59 -
 60
60 -
 61
61 -
 62
62 -
 63
63 -
 64
64 -
 65
65 -
66
-
67
-
68
-
69
-
70
-
71
-
72
-
73
-
74
 |
 |
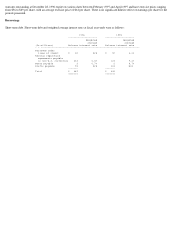
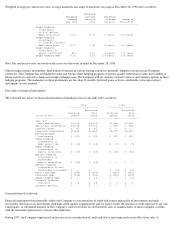
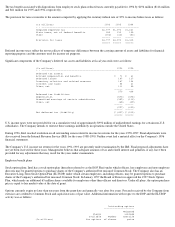
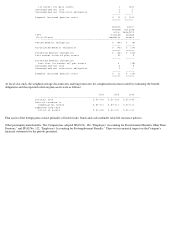
Weighted average pay and receive rates, average maturities and range of maturities on swaps at December 28, 1996 were as follows:
Note: Pay and receive rates are based on the reset rates that were in effect at December 28, 1996.
Other foreign currency instruments. Intel transacts business in various foreign currencies, primarily Japanese yen and certain European
currencies. The Company has established revenue and balance sheet hedging programs to protect against reductions in value and volatility of
future cash flows caused by changes in foreign exchange rates. The Company utilizes currency forward contracts and currency options in these
hedging programs. The maturities on these instruments are less than 12 months. Deferred gains or losses attributable to foreign currency
instruments are not material.
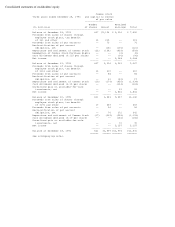
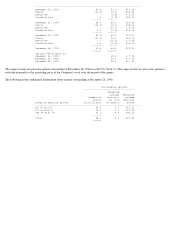
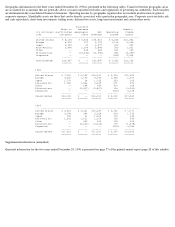
Fair values of financial instruments
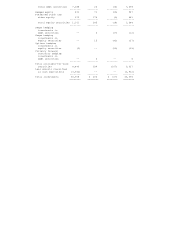
The estimated fair values of financial instruments outstanding at fiscal year-ends were as follows:
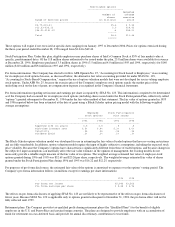
Concentrations of credit risk
Financial instruments that potentially subject the Company to concentrations of credit risk consist principally of investments and trade
receivables. Intel places its investments with high-credit-quality counterparties and, by policy, limits the amount of credit exposure to any one
counterparty. A substantial majority of the Company's trade receivables are derived from sales to manufacturers of microcomputer systems,
with the remainder spread across various other industries.
During 1995, the Company experienced an increase in its concentration of credit risk due to increasing trade receivables from sales to
Weighted
Weighted average Weighted
average receive average Range of
pay rate rate maturity maturities
- - -----------------------------------------------------------------------
Swaps hedging
investments
in U.S. dollar
debt securities 6.3% 5.7% .7 years 0-2 years
Swaps hedging
investments
in foreign currency
debt securities 8.7% 7.4% .8 years 0-3 years
Swaps hedging
investments in
equity securities N/A 5.6% .4 years 0-1 years
Swaps hedging debt 5.6% 6.9% 3.9 years 2-5 years
1996 1995
--------------------- --------------------
Estimated Estimated
Carrying fair Carrying fair
(In millions) amount value amount value
- - ------------------------------------------------------------------------
Cash and
cash equivalents $4,165 $4,165 $1,463 $1,463
Short-term investments $3,736 $3,736 $ 995 $ 995
Trading assets $ 87 $ 87 $ -- $ --
Long-term investments $1,418 $1,418 $1,699 $1,699
Non-marketable
instruments $ 119 $ 194 $ 239 $ 259
Swaps hedging
investments in
debt securities $ (12) $ (12) $ (7) $ (7)
Swaps hedging
investments in
equity securities $ (27) $ (27) $ (42) $ (42)
Options hedging
investments in
marketable
equity securities $ (25) $ (25) $ -- $ --
Options hedging
investments in non-
marketable instruments $ -- $ -- $ (9) $ (13)
Short-term debt $ (389) $ (389) $ (346) $ (346)
Long-term debt $ (728) $ (731) $ (400) $ (399)
Swaps hedging debt $ -- $ 13 $ -- $ (1)
Currency forward
contracts $ 5 $ 18 $ 3 $ 4
Currency options $ -- $ -- $ -- $ --