Intel 1996 Annual Report Download - page 44
Download and view the complete annual report
Please find page 44 of the 1996 Intel annual report below. You can navigate through the pages in the report by either clicking on the pages listed below, or by using the keyword search tool below to find specific information within the annual report.-
 1
1 -
2
-
3
-
4
-
5
-
6
-
7
-
8
-
9
-
10
-
11
-
12
-
13
-
14
-
15
-
16
-
17
-
18
-
19
-
20
-
21
-
22
-
23
-
24
-
25
-
26
-
27
-
28
-
29
-
30
-
31
-
32
-
33
-
 34
34 -
 35
35 -
 36
36 -
 37
37 -
 38
38 -
 39
39 -
 40
40 -
 41
41 -
 42
42 -
 43
43 -
 44
44 -
 45
45 -
 46
46 -
 47
47 -
 48
48 -
 49
49 -
 50
50 -
 51
51 -
 52
52 -
 53
53 -
 54
54 -
55
-
56
-
57
-
58
-
59
-
60
-
61
-
62
-
63
-
64
-
65
-
66
-
67
-
68
-
69
-
70
-
71
-
72
-
73
-
74
 |
 |
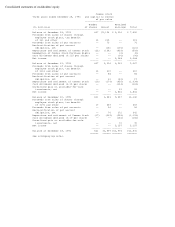
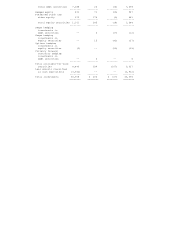
Consolidated statements of cash flows
Three years ended December 28, 1996
(In millions) 1996 1995 1994
- - ----------------------------------------------------------------------------
Cash and cash equivalents,
beginning of year $ 1,463 $ 1,180 $ 1,659
------- ------- -------
Cash flows provided by (used for)
operating activities:
Net income 5,157 3,566 2,288
Adjustments to reconcile net income
to net cash provided by (used for)
operating activities:
Depreciation 1,888 1,371 1,028
Net loss on retirements of property,
plant and equipment 120 75 42
Amortization of debt discount -- 8 19
Change in deferred tax assets and
liabilities 179 346 (150)
Changes in assets and liabilities:
(Increase) in accounts receivable (607) (1,138) (530)
Decrease (increase) in inventories 711 (835) (331)
(Increase) in other assets (7) (251) (57)
Increase in accounts payable 105 289 148
Tax benefit from employee stock plans 196 116 61
Purchase of trading assets (75) - -
(Gain) on trading assets (12) - -
Increase in income taxes payable 185 372 38
Increase in accrued compensation
and benefits 370 170 44
Increase (decrease) in other liabilities 533 (73) 337
------- ------- -------
Total adjustments 3,586 450 649
------- ------- -------
Net cash provided by operating activities 8,743 4,016 2,937
------- ------- -------
Cash flows provided by (used for) investing
activities:
Additions to property, plant and
equipment (3,024) (3,550) (2,441)
Purchases of available-for-sale
investments (4,683) (685) (3,168)
Sales of available-for-sale investments 225 114 10
Maturities and other changes in
available-for-sale investments 2,214 1,444 2,740
------- ------- -------
Net cash (used for) investing activities (5,268) (2,677) (2,859)
------- ------- -------
Cash flows provided by (used for) financing
activities:
Increase (decrease) in short-term debt,
net 43 (179) (63)
Additions to long-term debt 317 - 128
Retirement of long-term debt - (4) (98)
Proceeds from sales of shares
through employee stock plans and other 261 192 150
Proceeds from sales of put warrants 56 85 76
Repurchase and retirement of
Common Stock (1,302) (1,034) (658)
Payment of dividends to stockholders (148) (116) (92)
------- ------- -------
Net cash (used for) financing activities (773) (1,056) (557)
------- ------- -------
Net increase (decrease) in cash and
cash equivalents 2,702 283 (479)
------- ------- -------
Cash and cash equivalents, end of year $ 4,165 $ 1,463 $ 1,180
======= ======= =======
Supplemental disclosures of cash flow information:
Cash paid during the year for:
Interest $ 51 $ 182 $ 76
Income taxes $ 2,217 $ 1,209 $ 1,366
Cash paid for interest in 1995 includes approximately $108 million of
accumulated interest on Zero Coupon Notes that matured in 1995.
Certain 1995 and 1994 amounts have been reclassified to conform to
the 1996 presentation.
See accompanying notes.