Ingram Micro 2010 Annual Report Download - page 4
Download and view the complete annual report
Please find page 4 of the 2010 Ingram Micro annual report below. You can navigate through the pages in the report by either clicking on the pages listed below, or by using the keyword search tool below to find specific information within the annual report.
growth rates in nearly every country and our
best vendor-satisfaction ratings in ve years.
We further developed promising markets,
launching more than 30 growth initiatives
primarily designed for small- to medium-sized
businesses across multiple countries in 2010.
The region’s data capture/point-of-sale
(DC/POS) division also ourished as it transi-
tioned from several fragmented acquisitions
to a consolidated pan-European operation.
These efforts, combined with a fruitful demand
environment, generated a 15-percent revenue
increase and the region’s strongest full-year
operating margin in ve years.
In Asia Pacic, we produced 21-percent year-
over-year sales growth and closed 2010 with
annual sales at the highest levels of its history,
with the region representing 22 percent of our
geographic mix. China and India led the region
in sales growth, with both countries generating
more than 25-percent annual growth last year.
Asia Pacic is a market that readily embraces
new technologies and advanced solutions,
further reinforcing our current emphasis on
expanding our capabilities to capitalize on the
rapid pace of technology investment.
Latin America, with 9-percent revenue growth,
continues to represent a dynamic opportunity.
The region holds some of the company’s best-
performing countries and promising markets.
One of the region’s largest and most vital
markets is Brazil, where we are taking actions
to improve our operations by appointing new
leadership and implementing new procedures
and controls. While Brazil did not meet our
expectations, strong performances by Mexico,
Chile and our export operations helped to
offset Brazil’s results. We remain committed to
improving the Brazilian business and driving
the overall region to greater performance.
Budding Specialty Markets
Six years ago we entered the DC/POS busi-
ness through a small acquisition in the United
States. Through careful nurturing, Ingram
Micro now has DC/POS operations through-
out the world and the unique capability to
deliver global solutions for our customers.
This year, our momentum accelerated as
growth in DC/POS surpassed the company
average. Future trends favor companies
turning to DC/POS technology with greater
frequency to help automate their supply
chains and increase productivity.
Our fee-for-service logistics business reached
new heights this year with a growing client
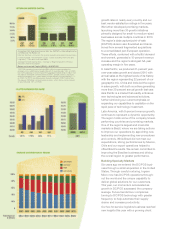
Annualized Net Operating Income after Tax (NOPAT) = (Operating Income
x [1-Effective Tax Rate] ) x 4
Effective Tax Rate = Provision for income taxes/Income before income taxes
Invested Capital = Stockholders’ Equity + Debt (including short-term and
long-term) - Cash and cash equivalents
Average Invested Capital (AIC) = Average of Beginning & End of Period
Amounts of Invested Capital
Return on Invested Capital (ROIC) = NOPAT/AIC
*Q3 2009 operating income included $8.4 million in expense-reduction
program costs, which had a negative impact of approximately 1.3% on ROIC;
Q4 2009 operating income included the aggregate benefit of $2.1 million from
the release of Brazilian commercial tax reserves, partially offset by expense-
reduction program costs, which had a positive impact of approximately 0.7%
on ROIC; Q4 2010 operating income included a benefit of $9.1 million from
the release of Brazilian commercial tax reserves, which had a positive impact
of approximately 1.3% on ROIC.


