Ingram Micro 2010 Annual Report Download - page 2
Download and view the complete annual report
Please find page 2 of the 2010 Ingram Micro annual report below. You can navigate through the pages in the report by either clicking on the pages listed below, or by using the keyword search tool below to find specific information within the annual report.-
 1
1 -
 2
2 -
 3
3 -
 4
4 -
 5
5 -
 6
6 -
 7
7 -
 8
8 -
 9
9 -
 10
10 -
 11
11 -
 12
12 -
 13
13 -
14
-
15
-
16
-
17
-
18
-
19
-
20
-
21
-
22
-
23
-
24
-
25
-
26
-
27
-
28
-
29
-
30
-
31
-
32
-
33
-
34
-
35
-
36
-
37
-
38
-
39
-
40
-
41
-
42
-
43
-
44
-
45
-
46
-
47
-
48
-
49
-
50
-
51
-
52
-
53
-
54
-
55
-
56
-
57
-
58
-
59
-
60
-
61
-
62
-
63
-
64
-
65
-
66
-
67
-
68
-
69
-
70
-
71
-
72
-
73
-
74
-
75
-
76
-
77
-
78
-
79
-
80
-
81
-
82
-
83
-
84
-
85
-
86
-
87
-
88
-
89
-
90
-
91
-
92
-
93
-
94
-
95
-
96
 |
 |

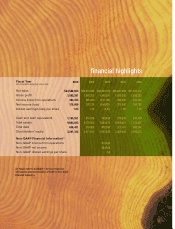
financial highlights
Fiscal Year
($ in thousands, except per share data)
Net sales
Gross prot
Income (loss) from operations
Net income (loss)
Diluted earnings (loss) per share
Cash and cash equivalents
Total assets
Total debt
Stockholders’ equity
Non-GAAP Financial Information(1)
Non-GAAP income from operations
Non-GAAP net income
Non-GAAP diluted earnings per share
2010
$34,588,984
1,892,291
484,433
318,060
1.94
1,155,551
9,084,032
636,401
3,241,182
2009
$29,515,446
1,670,209
295,940
202,138
1.22
910,936
8,179,350
379,495
3,011,813
2008
$34,362,152
1,940,091
(332,169)
(394,921)
(2.37)
763,495
7,083,473
478,388
2,655,845
410,484
264,859
1.59
2007
$35,047,089
1,909,298
446,420
275,908
1.56
579,626
8,975,001
523,116
3,426,942
2006
$31,357,477
1,685,285
422,444
265,766
1.56
333,339
7,704,307
509,507
2,920,475
(1) Please refer to Schedule 1 for more detailed
information and reconciliation of GAAP to Non-GAAP
financial measures.